OPEN-SOURCE SCRIPT
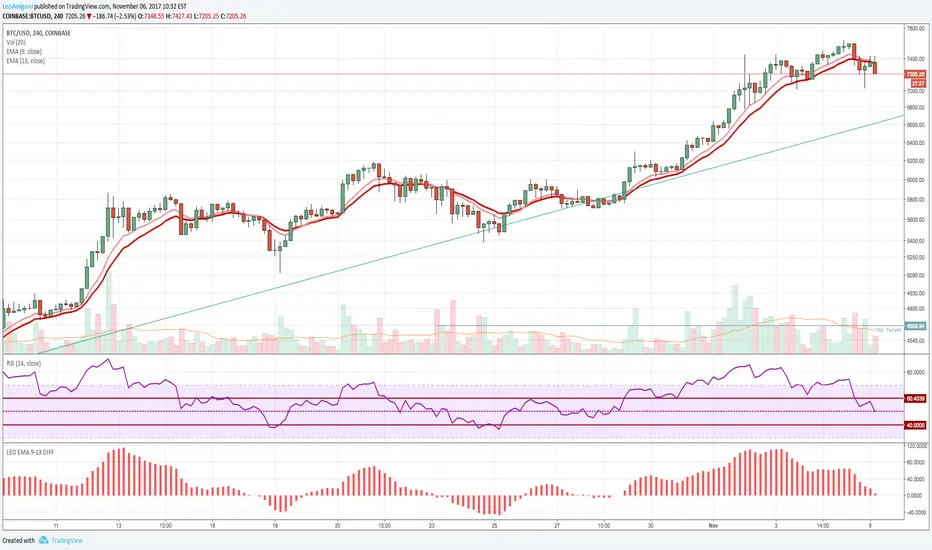
LEO EMA 9-13 DIFF
I made a public version of the private one that I made since I had so many requests.
Good indicator for buy and sell signals, better for buys usually works well on any timeframes. I use it on the 15m, 1hr, 4hr mostly.
You can plot the EMA's also on the chart to see the lines crossing but this indicator gives you a much easier read. It's very simple and basic all I do is plot the difference between the EMA 9 and the EMA 13. These values seem to give a very clear signal for entries and exits.
How to use.
- When the histogram becomes positive it's a buy signal when it becomes negative it's a sell signal.
- Note: Like any moving average this doesn't work well if you have a massive dip or a massive spike as the average will signal too late. but you should get some warning right before it happens.
Skrip open-source
Dengan semangat TradingView yang sesungguhnya, penulis skrip ini telah menjadikannya sumber terbuka, sehingga para trader dapat meninjau dan memverifikasi fungsinya. Hormat untuk penulisnya! Meskipun anda dapat menggunakannya secara gratis, ingatlah bahwa penerbitan ulang kode tersebut tunduk pada Tata Tertib kami.
Pernyataan Penyangkalan
Informasi dan publikasi tidak dimaksudkan untuk menjadi, dan bukan merupakan saran keuangan, investasi, perdagangan, atau rekomendasi lainnya yang diberikan atau didukung oleh TradingView. Baca selengkapnya di Persyaratan Penggunaan.