PROTECTED SOURCE SCRIPT
Diupdate SMT Divergence [TFO]

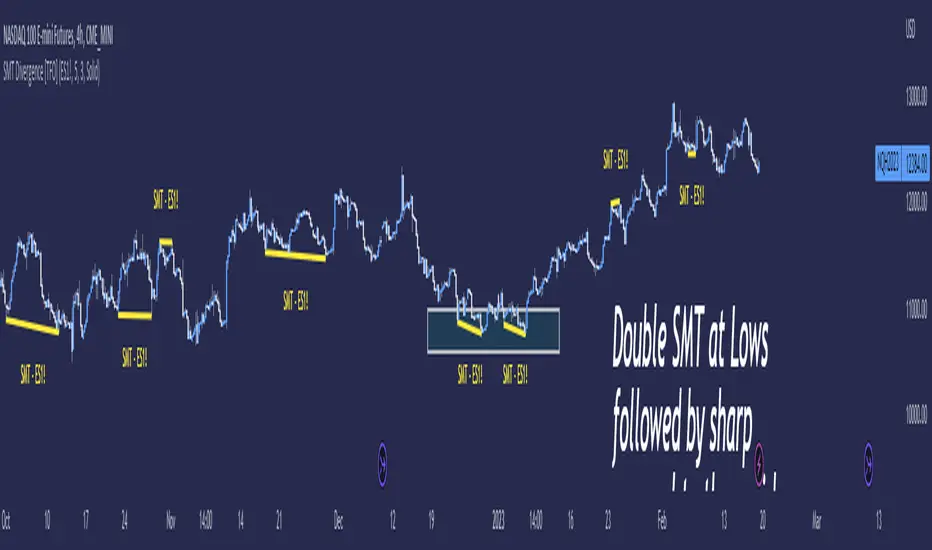
Smart Money Technique ( SMT ) Divergence is meant to annotate divergences between closely correlated assets. This indicator works by finding local lows and highs for both the current chart symbol and the symbol defined in the settings. It compares both symbols' pivots and evaluates whether they indicate a valid divergence (based on where they're located, whether they make opposing highs/lows, whether a clean connection can be made, etc.).
Take $ES_F and $NQ_F for example ( S&P 500 and Nasdaq 100 U.S. index futures ). These two names normally track each other very closely (and in the same direction, versus something like DXY ), but if $ES_F is steadily rising towards a large institutional level and making higher highs, while $NQ_F is approaching a similarly important level and making lower highs on that same timeframe, this would indicate a divergence between the two assets that could foreshadow a “Smart Money Reversal.”
We can look at diverging highs at resistance as potential reason to look for low timeframe reversal structure to get short, and likewise look at diverging lows near support as potential reason to look for reversal structure to get long. As with most trading concepts, the higher timeframes here are key in this analysis. Divergence on a 4h chart can be much more telling than divergence on a 1m chart; but assuming a higher timeframe bias is already formulated, then SMT could simply act as an additional confluence tool to enter a trade.
Take $ES_F and $NQ_F for example ( S&P 500 and Nasdaq 100 U.S. index futures ). These two names normally track each other very closely (and in the same direction, versus something like
We can look at diverging highs at resistance as potential reason to look for low timeframe reversal structure to get short, and likewise look at diverging lows near support as potential reason to look for reversal structure to get long. As with most trading concepts, the higher timeframes here are key in this analysis. Divergence on a 4h chart can be much more telling than divergence on a 1m chart; but assuming a higher timeframe bias is already formulated, then SMT could simply act as an additional confluence tool to enter a trade.
Catatan Rilis
Added alerts for SMT Divergence detection (can specifically alert SMT at highs, lows, or any)Skrip terproteksi
Skrip ini diterbitkan sebagai sumber tertutup. Namun, Anda dapat menggunakannya dengan bebas dan tanpa batasan apa pun – pelajari lebih lanjut di sini.
Pernyataan Penyangkalan
Informasi dan publikasi ini tidak dimaksudkan, dan bukan merupakan, saran atau rekomendasi keuangan, investasi, trading, atau jenis lainnya yang diberikan atau didukung oleh TradingView. Baca selengkapnya di Ketentuan Penggunaan.
Skrip terproteksi
Skrip ini diterbitkan sebagai sumber tertutup. Namun, Anda dapat menggunakannya dengan bebas dan tanpa batasan apa pun – pelajari lebih lanjut di sini.
Pernyataan Penyangkalan
Informasi dan publikasi ini tidak dimaksudkan, dan bukan merupakan, saran atau rekomendasi keuangan, investasi, trading, atau jenis lainnya yang diberikan atau didukung oleh TradingView. Baca selengkapnya di Ketentuan Penggunaan.