OPEN-SOURCE SCRIPT
Put-Call Bias Indicator

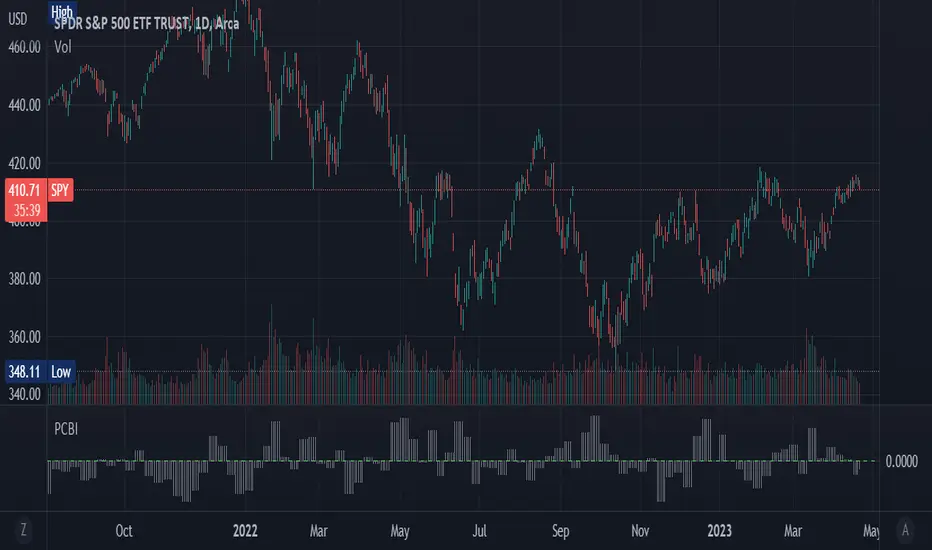
The Put-Call Bias Indicator provides a visual representation of the relative bias towards put options using CBOE data. This script calculates the Put/All ratio, displaying the difference as compared to an even 50% ratio as columns on the chart. A positive value indicates a higher proportion of puts being bought compared to the total number of options contracts.
The indicator uses weekly CBOE data to determine the Put/Call ratio, making it suitable for analyzing longer-term trends in options trading sentiment. The gray columns represent the bias towards puts, with the green horizontal line at 0 acting as a reference point to quickly identify the prevailing bias.
In addition to providing an overview of market sentiment, this indicator can also be used as a contrarian indicator. A high Put/All ratio may suggest that the market is overly bearish, potentially signaling a bullish reversal, while a low ratio may indicate an overly bullish market, potentially pointing to a bearish reversal. Please note that this indicator should be used in conjunction with other technical analysis tools and indicators for a comprehensive understanding of the market.
(This is a new version of an old script bc previous version was deleted by TradingView; republishing with a more verbose description)
Skrip open-source
Dengan semangat TradingView yang sesungguhnya, pembuat skrip ini telah menjadikannya sebagai sumber terbuka, sehingga para trader dapat meninjau dan memverifikasi fungsinya. Salut untuk penulisnya! Meskipun Anda dapat menggunakannya secara gratis, perlu diingat bahwa penerbitan ulang kode ini tunduk pada Tata Tertib kami.
Pernyataan Penyangkalan
Informasi dan publikasi ini tidak dimaksudkan, dan bukan merupakan, saran atau rekomendasi keuangan, investasi, trading, atau jenis lainnya yang diberikan atau didukung oleh TradingView. Baca selengkapnya di Ketentuan Penggunaan.