OPEN-SOURCE SCRIPT
Diupdate Modified Mannarino Market Risk Indicator & Bubbles
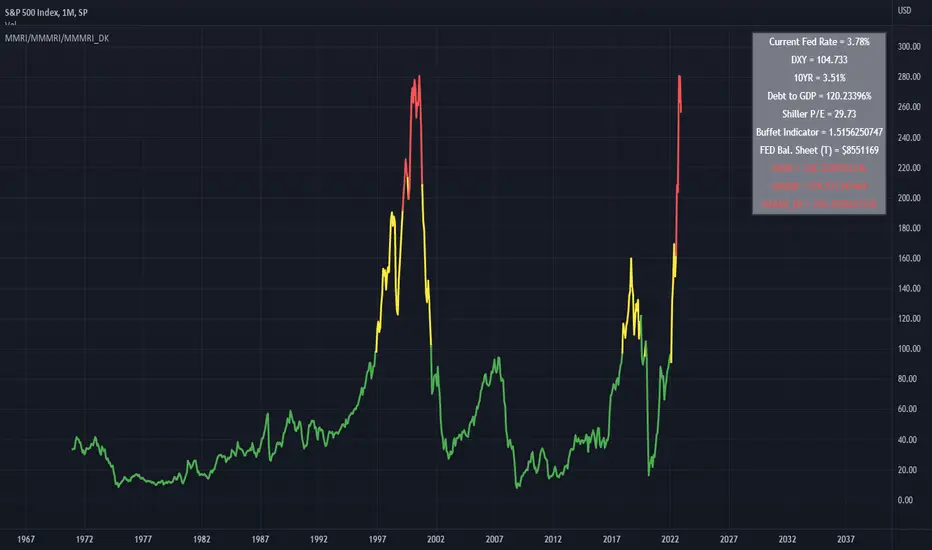
Modified Mannarino Market Risk Indicator
MMRI = DXY * 10Y Yield
MMMRI = MMRI * (Debt/GDP)
- Color Indicators
Green ~ Low Risk
Yellow - Mod Risk
Red - High Risk
Purple - Extreme Risk
*
Bubbles Formula (MMMRI_DK)
DXY*(10Y + FED Rate)* (Shiller P/E Ratio) * (Warren Buffet Indicator)*(Debt/GDP) /1.61
Similar to the Shiller P/E Ratio - you need to look back to see where the bubbles were. The difference between the Dot Com bubble and subsequent ones is that we now have QE which is why I included the FED Rate + 10Y.
*Color Indicators
Green ~ Low Risk
Yellow - Mod Risk
Red - High Risk
Purple - Extreme Risk
Future Bubbles Formula (MMMRI_DK_Fut)
DXY*(10Y + Future FED Rate)* (Shiller P/E Ratio) * (Warren Buffet Indicator)*(Debt/GDP) /1.61
Assumes that the 10Y is fixed but what is important is that you will get an idea on when the system may pop.
Catatan Rilis
Bug FixSkrip open-source
Dengan semangat TradingView yang sesungguhnya, pembuat skrip ini telah menjadikannya sebagai sumber terbuka, sehingga para trader dapat meninjau dan memverifikasi fungsinya. Salut untuk penulisnya! Meskipun Anda dapat menggunakannya secara gratis, perlu diingat bahwa penerbitan ulang kode ini tunduk pada Tata Tertib kami.
Pernyataan Penyangkalan
Informasi dan publikasi ini tidak dimaksudkan, dan bukan merupakan, saran atau rekomendasi keuangan, investasi, trading, atau jenis lainnya yang diberikan atau didukung oleh TradingView. Baca selengkapnya di Ketentuan Penggunaan.
Skrip open-source
Dengan semangat TradingView yang sesungguhnya, pembuat skrip ini telah menjadikannya sebagai sumber terbuka, sehingga para trader dapat meninjau dan memverifikasi fungsinya. Salut untuk penulisnya! Meskipun Anda dapat menggunakannya secara gratis, perlu diingat bahwa penerbitan ulang kode ini tunduk pada Tata Tertib kami.
Pernyataan Penyangkalan
Informasi dan publikasi ini tidak dimaksudkan, dan bukan merupakan, saran atau rekomendasi keuangan, investasi, trading, atau jenis lainnya yang diberikan atau didukung oleh TradingView. Baca selengkapnya di Ketentuan Penggunaan.