OPEN-SOURCE SCRIPT
TASC 2022.10 RS VA EMA
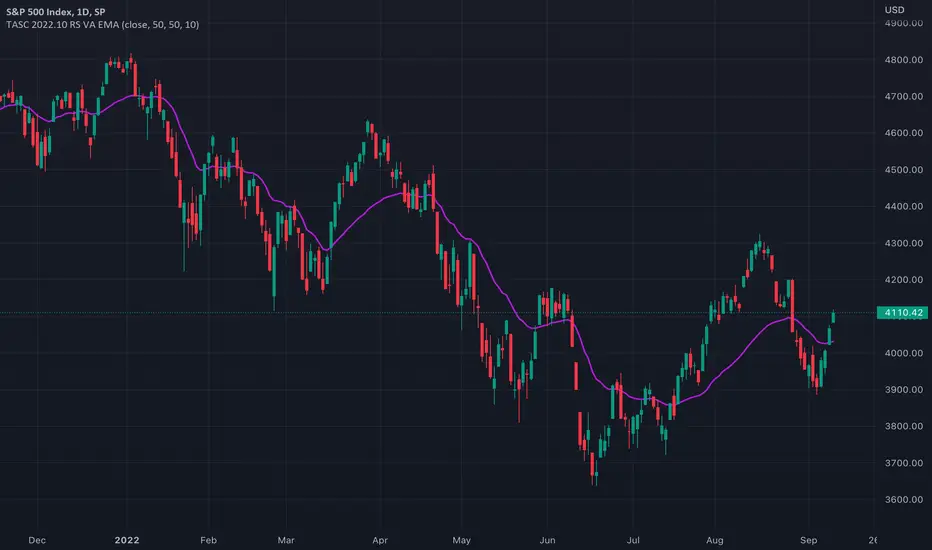
█ OVERVIEW
TASC's October 2022 edition Traders' Tips includes the second part of the "Relative Strength Moving Averages" article series authored by Vitali Apirine. This is the code that implements the Relative Strength Volume-Adjusted Exponential Moving Average (RS VA EMA) presented in this publication.
█ CONCEPTS
In his article series, the author argues that the relative strength of price, volume, and volatility can potentially be used to filter price movements and define turning points. In particular, the RS VA EMA indicator is designed to account for the relative strength of volume. Like the traditional exponential moving average (EMA), it is a lagging trend-following indicator. The difference is that it responds more quickly.
In a trading strategy, RS VA EMA is suggested to be used in combination with EMA of the same length to determine the overall trend or in combination with RS VA EMA of a different length to identify turning points and filter price movements.
█ CALCULATIONS
The calculation of RS VA EMA is based on the concept of volume strength (VS). By definition, VS measures the difference between "positive" and "negative" volume flow. Volume is indicated as "positive" when the close is higher than the previous close and "negative" when the close is below the previous close.
The following steps are used in the calculation process:
• Calculate the volume strength (VS) of a given length.
• Multiply VS by a predefined multiplier and calculate the EMA of the resulting time series.
The values of 10,10,10 are the typical input settings for RS VA EMA, where the first parameter is the length of the moving average, the second is the length of VS, and the third is the volume strength multiplier.
Skrip open-source
Dengan semangat TradingView yang sesungguhnya, pembuat skrip ini telah menjadikannya sebagai sumber terbuka, sehingga para trader dapat meninjau dan memverifikasi fungsinya. Salut untuk penulisnya! Meskipun Anda dapat menggunakannya secara gratis, perlu diingat bahwa penerbitan ulang kode ini tunduk pada Tata Tertib kami.
Tools and ideas for all Pine coders: tradingview.com/u/PineCoders/
TASC: traders.com/
TASC: traders.com/
Pernyataan Penyangkalan
Informasi dan publikasi ini tidak dimaksudkan, dan bukan merupakan, saran atau rekomendasi keuangan, investasi, trading, atau jenis lainnya yang diberikan atau didukung oleh TradingView. Baca selengkapnya di Ketentuan Penggunaan.