OPEN-SOURCE SCRIPT
Diupdate Volume Traded in Total Outstanding Shares with basic fundamental
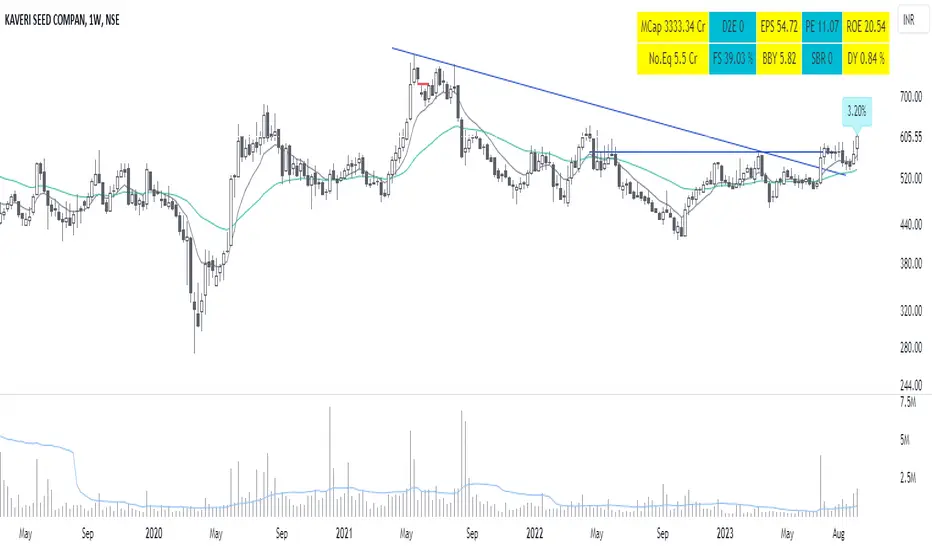
This indicator helps to find Volume Traded in Total Outstanding Shares with basic fundamental parameters like MCAP, EPS, PE, D2E and No. Equity shares.
Catatan Rilis
This indicator helps you to find percentage of stocks traded in a day/week compare to total outstanding shares and few important basic fundamental details of the stock such as, MCap - Market Capitalization
Market capitalization -the total market value of a cryptocurrency circulating supply. A version of Market Capitalization indicator that uses maximum possible supply of the coin, called Fully Diluted Market Capitalization.
EPS - Earning per share
Earnings per Share is the amount of earnings per share of issued, ordinary shares. When companies report financial results, earnings per share is one of the most commonly measured metrics.
PE - Price to Earnings
The Price to earnings ratio measures the market price of a stock relative to its earnings per share. This metric shows how much investors are willing to pay for the profits the company generates.
ROE - Return on Equity
Return on equity is Net income divided by the average of Total shareholders' equity for the last period. Note: if the Total shareholders’ equity is negative, the ratio will be empty or non-existent.
No.Eq - Total common shares outstanding
Total common shares outstanding represents the number of common/ordinary shares issued and actively held by shareholders at the end of the period.
FS - Float shares outstanding
Float shares outstanding represent the number of issued common shares available for open trading on stock exchanges and other financial markets. It excludes closely held or insider shares owned by a company's corporate management and employees, institutional investors who have controlling stakes or seats on the board of directors, or company-owned foundations.
BBY - Buyback yield
Buyback yield is the percentage of the amount spent by a company to repurchase its own shares to its market capitalization. A high Buyback yield may indicate that a stock is undervalued or actively repurchasing its shares.
SBR - Shares buyback ratio
This metric shows the percentage change in Common shares outstanding.
A positive value indicates that the number of shares is declining, while negative values mean that the company is releasing new Common shares. A company can shrink its share base by buying stock back and slowing down the issuance of new shares
DY - Dividend Yield
The dividend yield shows how much a company pays in dividends per year relative to the price of the underlying asset that pays out the dividend. It’s listed as a percentage and is presented as a financial ratio.
Skrip open-source
Dengan semangat TradingView yang sesungguhnya, pembuat skrip ini telah menjadikannya sebagai sumber terbuka, sehingga para trader dapat meninjau dan memverifikasi fungsinya. Salut untuk penulisnya! Meskipun Anda dapat menggunakannya secara gratis, perlu diingat bahwa penerbitan ulang kode ini tunduk pada Tata Tertib kami.
Pernyataan Penyangkalan
Informasi dan publikasi ini tidak dimaksudkan, dan bukan merupakan, saran atau rekomendasi keuangan, investasi, trading, atau jenis lainnya yang diberikan atau didukung oleh TradingView. Baca selengkapnya di Ketentuan Penggunaan.