OPEN-SOURCE SCRIPT
Diupdate Linear Regression Volume Profile
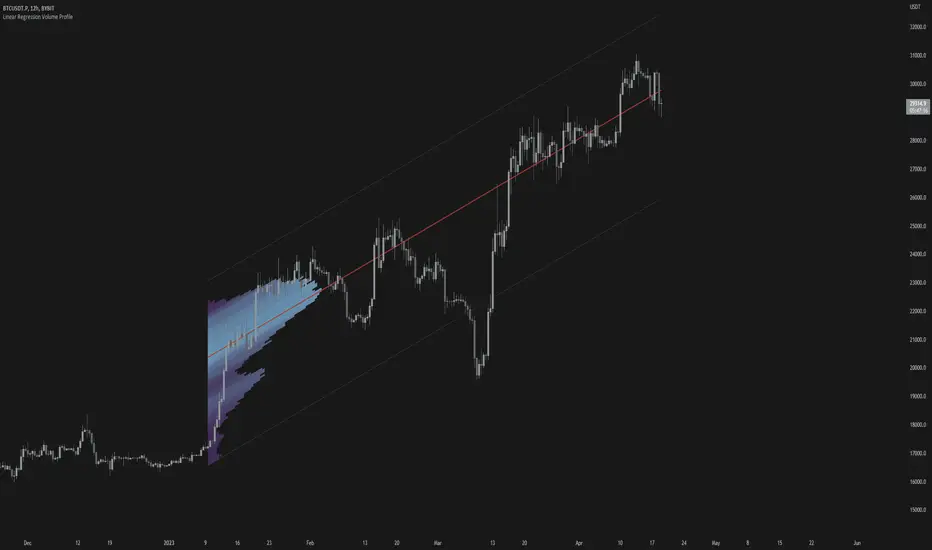
Linear Regression Volume Profile plots the volume profile fixated on the linear regression of the lookback period rather than statically across y = 0. This helps identify potential support and resistance inside of the price channel.
Settings
Linear Regression
Linear Regression
Usage
Similar to the traditional Linear Regression and Volume Profile this indicator is mainly to determine levels of support and resistance. One may interpret a level with high volume (i.e. point of control) to be a potential reversal point.
Details
This indicator first calculates the linear regression of the specified lookback period and, subsequently, the upper and lower bound of the linear regression channel. It then divides this channel by the specified number of rows and sums the volume that occurs in each row. The volume profile is scaled to the min and max volume.
Settings
Linear Regression
- Linear Regression Source: the price source in which to sample when calculating the linear regression
- Length: the number of bars to sample when calculating the linear regression
- Deviation: the number of standard deviations away from the linear regression line to draw the upper and lower bounds
Linear Regression
- Rows: the number of rows to divide the linear regression channel into when calculating the volume profile
- Show Point of Control: toggle whether or not to plot the level with highest amount of volume
Usage
Similar to the traditional Linear Regression and Volume Profile this indicator is mainly to determine levels of support and resistance. One may interpret a level with high volume (i.e. point of control) to be a potential reversal point.
Details
This indicator first calculates the linear regression of the specified lookback period and, subsequently, the upper and lower bound of the linear regression channel. It then divides this channel by the specified number of rows and sums the volume that occurs in each row. The volume profile is scaled to the min and max volume.
Catatan Rilis
- fixed bug regarding linear regression length being longer than bar_index
- updated chart
Catatan Rilis
- Fixed custom Point of Control color
Skrip open-source
Dengan semangat TradingView yang sesungguhnya, pembuat skrip ini telah menjadikannya sebagai sumber terbuka, sehingga para trader dapat meninjau dan memverifikasi fungsinya. Salut untuk penulisnya! Meskipun Anda dapat menggunakannya secara gratis, perlu diingat bahwa penerbitan ulang kode ini tunduk pada Tata Tertib kami.
Pernyataan Penyangkalan
Informasi dan publikasi ini tidak dimaksudkan, dan bukan merupakan, saran atau rekomendasi keuangan, investasi, trading, atau jenis lainnya yang diberikan atau didukung oleh TradingView. Baca selengkapnya di Ketentuan Penggunaan.