OPEN-SOURCE SCRIPT
Buy When There's Blood in the Streets Strategy
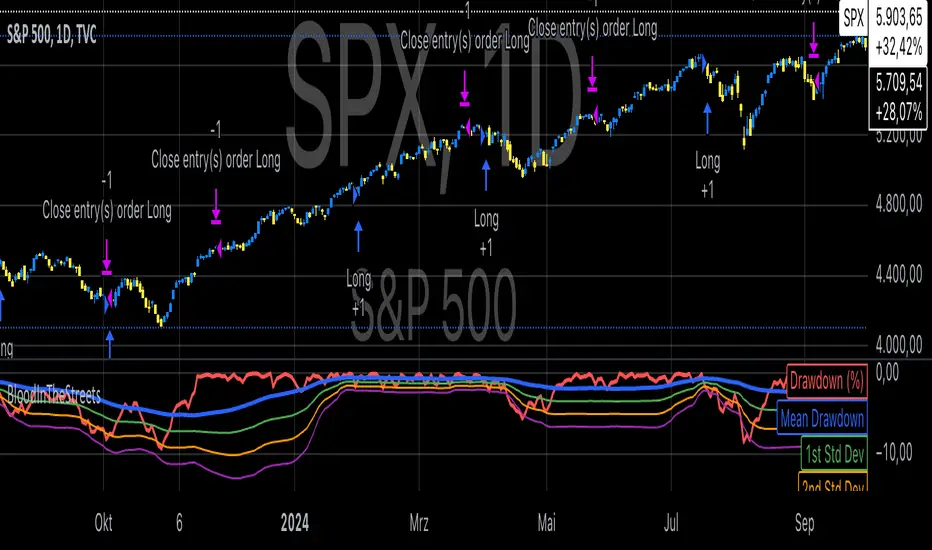
Statistical Analysis of Drawdowns in Stock Markets
Drawdowns, defined as the decline from a peak to a trough in asset prices, are an essential measure of risk and market dynamics. Their statistical properties provide insights into market behavior during extreme stress periods.
Distribution of Drawdowns: Research suggests that drawdowns follow a power-law distribution, implying that large drawdowns, while rare, are more frequent than expected under normal distributions (Sornette et al., 2003).
Impacts of Extreme Drawdowns: During significant drawdowns (e.g., financial crises), the average recovery time is significantly longer, highlighting market inefficiencies and behavioral biases. For example, the 2008 financial crisis led to a 57% drawdown in the S&P 500, requiring years to recover (Cont, 2001).
Using Standard Deviations: Drawdowns exceeding two or three standard deviations from their historical mean are often indicative of market overreaction or capitulation, creating contrarian investment opportunities (Taleb, 2007).
Behavioral Finance Perspective: Investors often exhibit panic-selling during drawdowns, leading to oversold conditions that can be exploited using statistical thresholds like standard deviations (Kahneman, 2011).
Practical Implications: Studies on mean reversion show that extreme drawdowns are frequently followed by periods of recovery, especially in equity markets. This underpins strategies that "buy the dip" under specific, statistically derived conditions (Jegadeesh & Titman, 1993).
References:
Sornette, D., & Johansen, A. (2003). Stock market crashes and endogenous dynamics.
Cont, R. (2001). Empirical properties of asset returns: stylized facts and statistical issues. Quantitative Finance.
Taleb, N. N. (2007). The Black Swan: The Impact of the Highly Improbable.
Kahneman, D. (2011). Thinking, Fast and Slow.
Jegadeesh, N., & Titman, S. (1993). Returns to Buying Winners and Selling Losers: Implications for Stock Market Efficiency.
Skrip open-source
Dengan semangat TradingView yang sesungguhnya, pembuat skrip ini telah menjadikannya sebagai sumber terbuka, sehingga para trader dapat meninjau dan memverifikasi fungsinya. Salut untuk penulisnya! Meskipun Anda dapat menggunakannya secara gratis, perlu diingat bahwa penerbitan ulang kode ini tunduk pada Tata Tertib kami.
Where others speculate, we systematize.
edgetools.org
edgetools.org
Pernyataan Penyangkalan
Informasi dan publikasi ini tidak dimaksudkan, dan bukan merupakan, saran atau rekomendasi keuangan, investasi, trading, atau jenis lainnya yang diberikan atau didukung oleh TradingView. Baca selengkapnya di Ketentuan Penggunaan.