PROTECTED SOURCE SCRIPT
Diupdate PVA Volume - DataCrypto Analytics
The PVA Volume indicator (Price Volume Analysis) is a technical indicator that transforms the accumulated historical data.
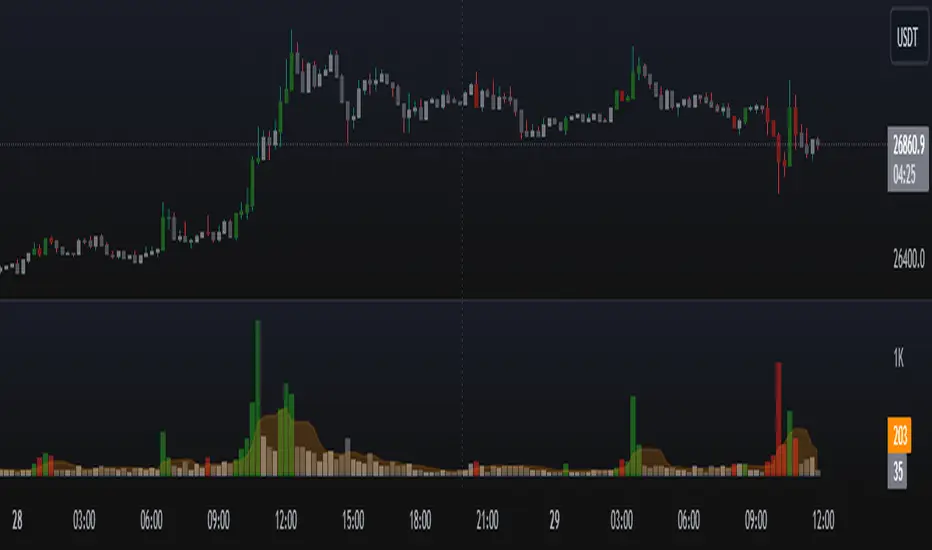
The PVA Volume Indicator displays a color-coded volume histogram based on Price Volume Analysis (PVA). It is plotted on a separate panel below the price chart of the underlying asset and colors the candles according to the PVA. The indicator represents four market states by means of four different colored histogram bars:
Green : Extreme volume on a bullish candle
Red : Extreme volume on a bearish candle
Silver : Neutral Volume, increasing more than the average
Gray : Neutral Volume
The PVA Volume indicator can be applied to confirm the action of the high or low price of any financial instrument.
Catatan Rilis
- Update to version 5- Code organization
Skrip terproteksi
Skrip ini diterbitkan sebagai sumber tertutup. Namun, Anda dapat menggunakannya dengan bebas dan tanpa batasan apa pun – pelajari lebih lanjut di sini.
Pernyataan Penyangkalan
Informasi dan publikasi ini tidak dimaksudkan, dan bukan merupakan, saran atau rekomendasi keuangan, investasi, trading, atau jenis lainnya yang diberikan atau didukung oleh TradingView. Baca selengkapnya di Ketentuan Penggunaan.