OPEN-SOURCE SCRIPT
Chart Mojo Neutral Unwound Cloud
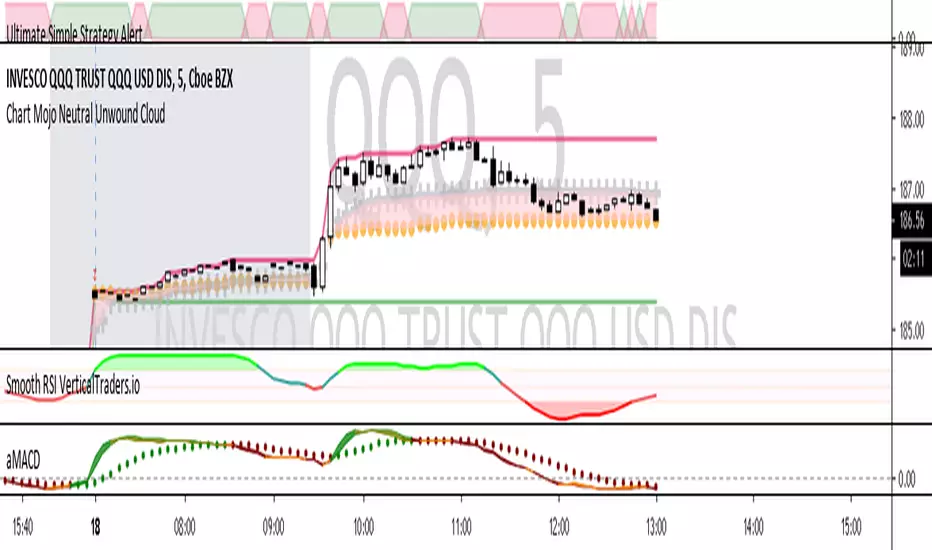
Plots days high/low and the Chart Mojo neutral cloud, the zone between vwap and 50% range. A secondary gravity right behind the opening 1 min range. The gray crosses are the vwap the gold dots are 50% of developing range. The shaded area between vwap and 50% range is the Chart Mojo cloud...I think of it as traders from the open tend to unwind to it many times a day. More returns on a trend day but you will see urges toward it on trend days. Price tends to urge to it ahead of 10:30 session "1" and 1:15 Session 2. If you get used to watching it and its relationship to price and the opening 1 min range you should start to see tendencies as to when price unwinds toward it.. etc. Where price is in relation to the cloud and the clouds relationship to the opening 1 min range can reveal real time bias. You will being to see, upon observation how traders target the vwap and 50% with target tier of buys and sells etc. Often unwinds to the zones gravity. It takes force or a catalyst to break the gravity. I use it in conjuction with Time Zone theory and Wave and Pattern force...and look to leading correlating hi beta movers and internals like tick and new streaming highs-new straming lows to get jump on what you see on a big etf or index etc. If you intraday tendencies the neutral is very helpful.
Skrip open-source
Dengan semangat TradingView yang sesungguhnya, pembuat skrip ini telah menjadikannya sebagai sumber terbuka, sehingga para trader dapat meninjau dan memverifikasi fungsinya. Salut untuk penulisnya! Meskipun Anda dapat menggunakannya secara gratis, perlu diingat bahwa penerbitan ulang kode ini tunduk pada Tata Tertib kami.
Pernyataan Penyangkalan
Informasi dan publikasi ini tidak dimaksudkan, dan bukan merupakan, saran atau rekomendasi keuangan, investasi, trading, atau jenis lainnya yang diberikan atau didukung oleh TradingView. Baca selengkapnya di Ketentuan Penggunaan.