PROTECTED SOURCE SCRIPT
Diupdate MTF RSI Channel Smoothed (Linear Regression)

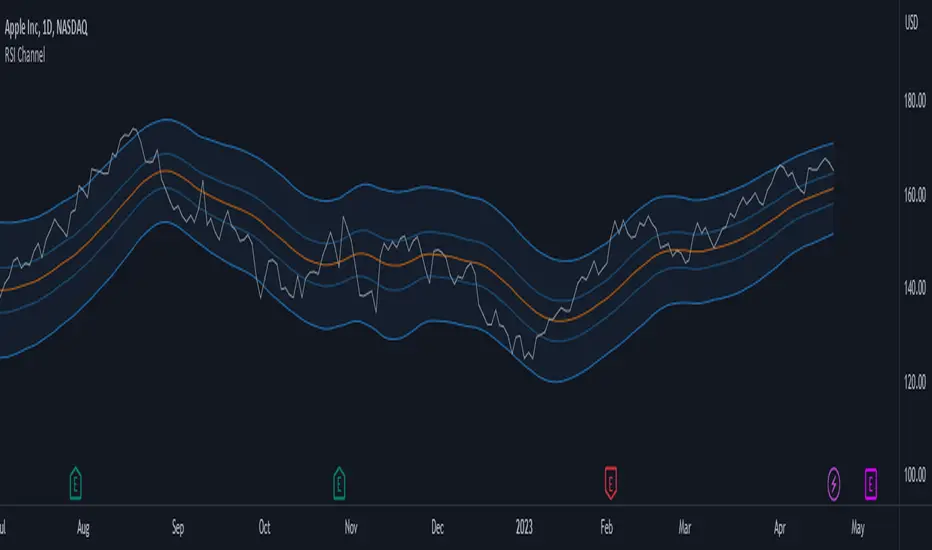
The "MTF RSI Channel Smoothed (Linear Regression)" indicator is a momentum oscillator that displays smoothed RSI bands across multiple timeframes.
What sets this indicator apart is that it uses linear regression to smooth the RSI bands. Linear regression is a statistical technique that helps filter out the noise in the data, resulting in smoother and more precise RSI bands. This provides traders with a more advanced and reliable tool for monitoring the RSI bands across multiple timeframes.
One of the primary advantages of using linear regression to smooth the RSI bands is that it provides a more accurate and reliable way to identify overbought and oversold levels of the asset. The linear regression method smooths out the data by reducing the impact of temporary price fluctuations, allowing traders to see the underlying trend more clearly. This helps traders to make more informed trading decisions by identifying key levels of support and resistance, and spotting potential entry and exit points.
Another advantage of the "Multi-Timeframe Smoothed RSI Bands" indicator is that it allows traders to adjust the length of the smoothing period using the "Smooth Period" parameter. This flexibility gives traders the ability to fine-tune the indicator to their specific trading style and preferences, resulting in a more personalized and effective trading tool.
Overall, the "Multi-Timeframe Smoothed RSI Bands" indicator is a powerful tool for traders looking to monitor the RSI bands across multiple timeframes. By using linear regression to smooth the data, this indicator provides traders with a more accurate and reliable way to identify potential trading opportunities, and make more informed trading decisions.
Catatan Rilis
minor changesSkrip terproteksi
Skrip ini diterbitkan sebagai sumber tertutup. Namun, Anda dapat menggunakannya dengan bebas dan tanpa batasan apa pun – pelajari lebih lanjut di sini.
Plan the trade ⚡ Trade the plan
Pernyataan Penyangkalan
Informasi dan publikasi ini tidak dimaksudkan, dan bukan merupakan, saran atau rekomendasi keuangan, investasi, trading, atau jenis lainnya yang diberikan atau didukung oleh TradingView. Baca selengkapnya di Ketentuan Penggunaan.
Skrip terproteksi
Skrip ini diterbitkan sebagai sumber tertutup. Namun, Anda dapat menggunakannya dengan bebas dan tanpa batasan apa pun – pelajari lebih lanjut di sini.
Plan the trade ⚡ Trade the plan
Pernyataan Penyangkalan
Informasi dan publikasi ini tidak dimaksudkan, dan bukan merupakan, saran atau rekomendasi keuangan, investasi, trading, atau jenis lainnya yang diberikan atau didukung oleh TradingView. Baca selengkapnya di Ketentuan Penggunaan.