PROTECTED SOURCE SCRIPT
Diupdate Vol-Sensitivity Ratio: dVIX% / dSPX%
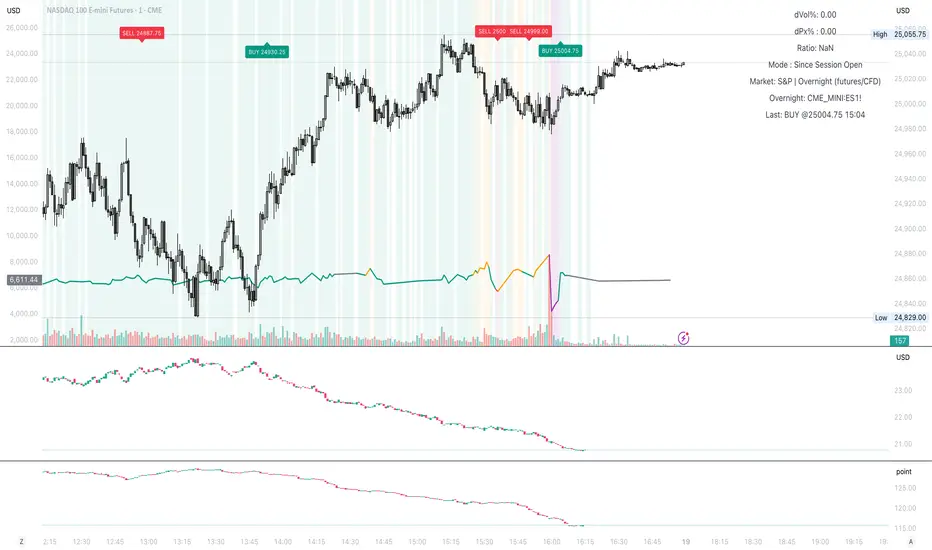
Vol-Sensitivity Ratio: dVIX% / dSPX%
Hey guys — I built a custom TradingView indicator to track how reactive the VIX is to SPX moves.
It’s basically a quick visual on market fear vs. complacency, and how volatility responds in real time.
How It Works
Calculates the ratio of VIX % change ÷ SPX % change
Shows color-coded zones for market behavior:
🔴 SPX & VIX rising → Bearish divergence
🟠 Weak VIX response → Complacency
🟩 Normal inverse → Healthy market
🟣 Extreme ratio → Volatility stress
How to Use
Add the script to your TradingView chart
Choose mode → Since Session Open (intraday) or From Prior Close (swing)
Watch the ratio line, color bands, and mini dashboard (shows dVIX%, dSPX%, and ratio)
It also supports alerts for when the market enters stress, divergence, or complacency zones.
Why I Made It
Hek often talks about VIX, VVIX, and volatility dynamics during trading.
That got me thinking about how to actually quantify the relationship instead of just “watching” it.
thanks to chatgpt I was able to turn into a visual
Now I’ll be forward-testing it in live markets and on a few prop accounts to see how useful it is in real-time conditions.
Feel free to try it out, tweak it, and share feedback or observations. Would love to see how it performs for others too.
Catatan Rilis
updatedCatatan Rilis
Live signals etc.Catatan Rilis
More updatesSkrip terproteksi
Skrip ini diterbitkan sebagai sumber tertutup. Namun, Anda dapat menggunakannya dengan bebas dan tanpa batasan apa pun – pelajari lebih lanjut di sini.
Pernyataan Penyangkalan
Informasi dan publikasi ini tidak dimaksudkan, dan bukan merupakan, saran atau rekomendasi keuangan, investasi, trading, atau jenis lainnya yang diberikan atau didukung oleh TradingView. Baca selengkapnya di Ketentuan Penggunaan.
Skrip terproteksi
Skrip ini diterbitkan sebagai sumber tertutup. Namun, Anda dapat menggunakannya dengan bebas dan tanpa batasan apa pun – pelajari lebih lanjut di sini.
Pernyataan Penyangkalan
Informasi dan publikasi ini tidak dimaksudkan, dan bukan merupakan, saran atau rekomendasi keuangan, investasi, trading, atau jenis lainnya yang diberikan atau didukung oleh TradingView. Baca selengkapnya di Ketentuan Penggunaan.