OPEN-SOURCE SCRIPT
Day of Week Performance
█ OVERVIEW
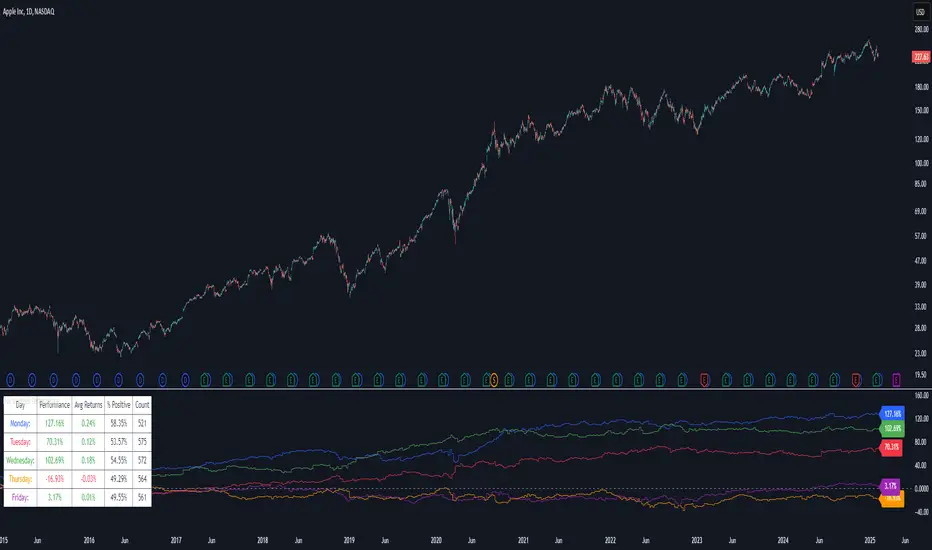
The Day of Week Performance indicator is designed to visualise and compare the cumulative percentage change for each day of the week. This indicator explores one of the many calendar based anomalies in financial markets.
In financial analysis, a calendar based anomaly refers to recurring patterns or tendencies associated with specific time periods, such as days of the week. By calculating the cumulative percentage change for each day (Monday through Friday) and displaying the results both graphically and in a summary table, this indicator helps identify whether certain days consistently outperform others.
█ FEATURES
█ HOW TO USE
Colour Scheme:
The Day of Week Performance indicator is designed to visualise and compare the cumulative percentage change for each day of the week. This indicator explores one of the many calendar based anomalies in financial markets.
In financial analysis, a calendar based anomaly refers to recurring patterns or tendencies associated with specific time periods, such as days of the week. By calculating the cumulative percentage change for each day (Monday through Friday) and displaying the results both graphically and in a summary table, this indicator helps identify whether certain days consistently outperform others.
█ FEATURES
- Customisable time window via Time Settings.
- Calculates cumulative percentage change for each day (Monday to Friday) separately.
- Option to use Sunday instead of Friday for CFDs and Futures analysis.
- Distinct visual representation for each day using unique colours.
- Customisable table settings including position and font size.
- Built-in error checks to ensure the indicator is applied on a Daily timeframe.
█ HOW TO USE
- Add the indicator to a chart set to a Daily timeframe.
- Select your desired Start Time and End Time in the Time Settings.
- Toggle the performance table on or off in the Table Settings.
- Adjust the table’s location and font size as needed.
- Use the "Use Sunday instead of Friday" option if your market requires it.
- View the cumulative performance plotted in distinct colours.
Colour Scheme:
- Monday: Blue
- Tuesday: Red
- Wednesday: Green
- Thursday: Orange
- Friday: Purple
Skrip open-source
Dengan semangat TradingView yang sesungguhnya, pembuat skrip ini telah menjadikannya sebagai sumber terbuka, sehingga para trader dapat meninjau dan memverifikasi fungsinya. Salut untuk penulisnya! Meskipun Anda dapat menggunakannya secara gratis, perlu diingat bahwa penerbitan ulang kode ini tunduk pada Tata Tertib kami.
Pernyataan Penyangkalan
Informasi dan publikasi ini tidak dimaksudkan, dan bukan merupakan, saran atau rekomendasi keuangan, investasi, trading, atau jenis lainnya yang diberikan atau didukung oleh TradingView. Baca selengkapnya di Ketentuan Penggunaan.