OPEN-SOURCE SCRIPT
Swing Oscillator [AstrideUnicorn]
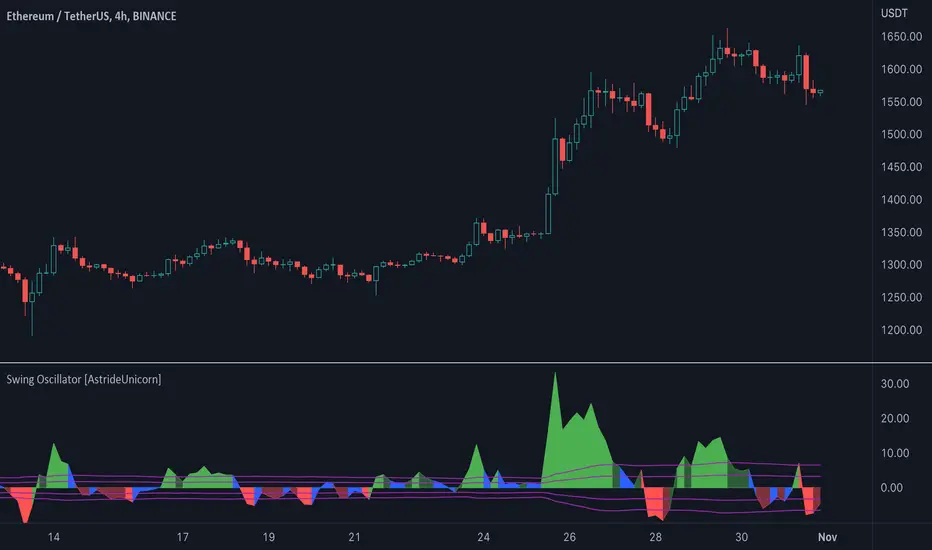
The Swing Oscillator is an indicator that can help you catch small price movements, called swings. Swings are minor trends that occur when price moves between the highs and lows of a trend or range. Because of the short-term nature of swings, a new movement should be identified as soon as possible.
The indicator is based on our original formula, which averages the length of candlestick bodies and compares the result to several thresholds. This allows the algorithm to determine the direction and strength of the price movement.
HOW TO USE
When the indicator is above the zero level and colored green, it means that the price is in an upward swing. When the indicator is below the zero level and colored red, the price is in a downward swing. When the indicator is blue, the price swing is slowing down or the market is moving sideways. The amplitude of the oscillator shows the price volatility.
Skrip open-source
Dengan semangat TradingView yang sesungguhnya, pembuat skrip ini telah menjadikannya sebagai sumber terbuka, sehingga para trader dapat meninjau dan memverifikasi fungsinya. Salut untuk penulisnya! Meskipun Anda dapat menggunakannya secara gratis, perlu diingat bahwa penerbitan ulang kode ini tunduk pada Tata Tertib kami.
Our premium trading indicators: unicorn.trading
Join our Discord community: dsc.gg/unicom
Join our Discord community: dsc.gg/unicom
Pernyataan Penyangkalan
Informasi dan publikasi ini tidak dimaksudkan, dan bukan merupakan, saran atau rekomendasi keuangan, investasi, trading, atau jenis lainnya yang diberikan atau didukung oleh TradingView. Baca selengkapnya di Ketentuan Penggunaan.