OPEN-SOURCE SCRIPT
Previous High/Low Range (D,W,M,Q)
Previous High/Low Range (D, W, M, Q)
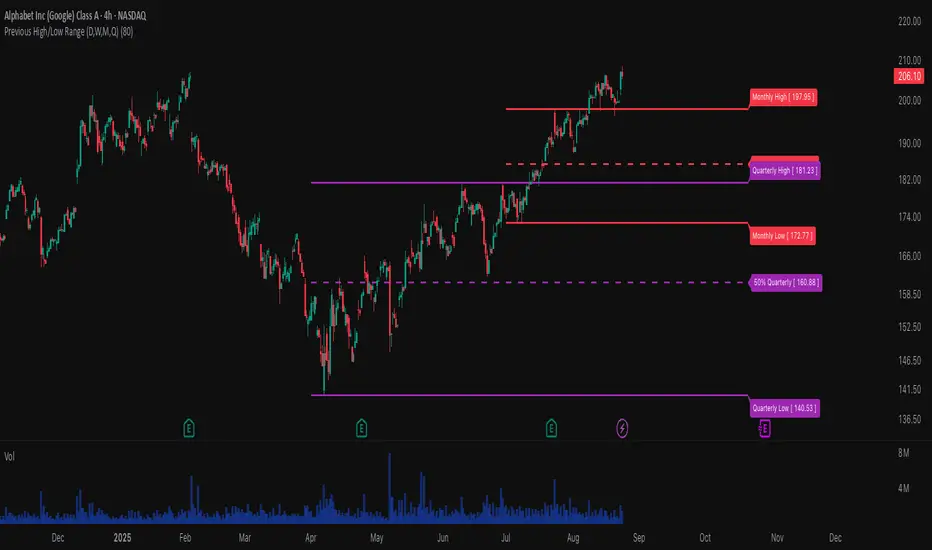
This indicator displays the previous period’s high, low, and midpoint levels across multiple timeframes: Daily, Weekly, Monthly, and Quarterly. It extends these key price levels into the future, allowing traders to quickly identify important support and resistance zones based on historical price action.
Features:
Shows previous Daily, Weekly, Monthly, and Quarterly highs, lows, and midpoints.
Optionally extends these levels forward for easy visualization.
Configurable colors and visibility for each timeframe.
Includes optional midpoint lines at 50% between high and low to identify equilibrium points.
Supports logarithmic scale calculations for midpoints to maintain accuracy on log charts.
Optional labels that display exact price values for each level.
Designed to help traders recognize key levels for entries, exits, and risk management.
Use this indicator to gain a multi-timeframe perspective on significant price ranges and anticipate potential reversal or breakout zones.
Skrip open-source
Dengan semangat TradingView yang sesungguhnya, penulis skrip ini telah menjadikannya sumber terbuka, sehingga para trader dapat meninjau dan memverifikasi fungsinya. Hormat untuk penulisnya! Meskipun anda dapat menggunakannya secara gratis, ingatlah bahwa penerbitan ulang kode tersebut tunduk pada Tata Tertib kami.
Pernyataan Penyangkalan
Informasi dan publikasi tidak dimaksudkan untuk menjadi, dan bukan merupakan saran keuangan, investasi, perdagangan, atau rekomendasi lainnya yang diberikan atau didukung oleh TradingView. Baca selengkapnya di Persyaratan Penggunaan.