OPEN-SOURCE SCRIPT
Diupdate Asymmetric volatility
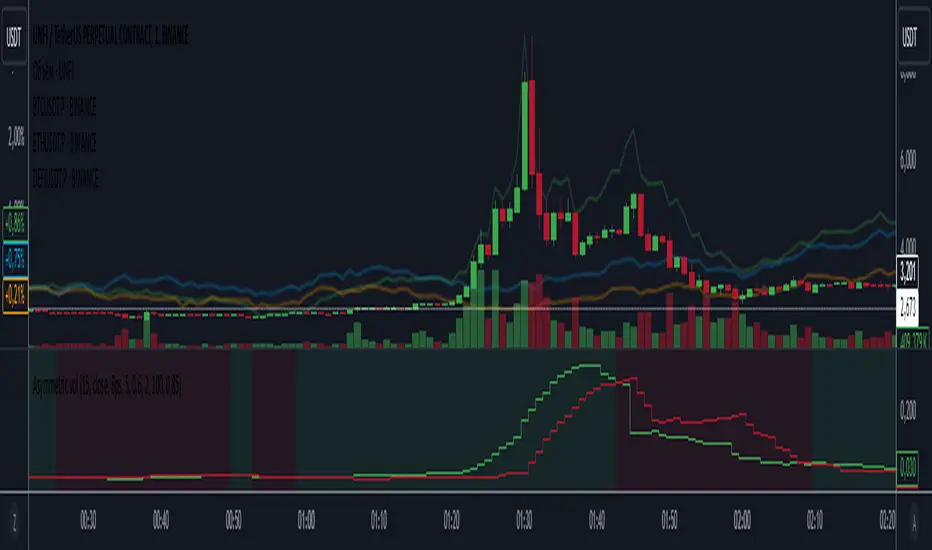
The "Asymmetric Volatility" indicator is designed to visualize the differences in volatility between upward and downward price movements of a selected instrument. It operates on the principle of analyzing price movements over a specified time period, with particular focus on the symmetrical evaluation of both price rises and falls.
User Parameters:
- Length: This parameter specifies the number of bars (candles) used to calculate the average volatility. The larger the value, the longer the time period, and the smoother the volatility data will be.
- Source: This represents the input data for the indicator calculations. By default, the close value of each bar is used, but the user can choose another data source (such as open, high, low, or any custom value).
Operational Algorithm:
1. Movement Calculation:
- UpMoves: Computed as the positive difference between the current bar value and the previous bar value, if it is greater than zero.
- DownMoves: Computed as the positive difference between the previous bar value and the current bar value, if it is greater than zero.
2. Volatility Calculation:
- UpVolatility: This is the arithmetic mean of the UpMoves values over the specified period.
- DownVolatility: This is the arithmetic mean of the DownMoves values over the specified period.
3. Graphical Representation:
- The indicator displays two plots: upward and downward volatility, represented by green and red lines, respectively.
- The background color changes based on which volatility is dominant: a green background indicates that upward volatility prevails, while a red background indicates downward volatility.
The indicator allows traders to quickly assess in which direction the market is more volatile at the moment, which can be useful for making trading decisions and evaluating the current market situation.
Catatan Rilis
Some refactoringCatatan Rilis
some refactoring. Added the ability to smooth McGinley Dynamic. Added the ability to normalize volatility to percentages.Skrip open-source
Dengan semangat TradingView yang sesungguhnya, pembuat skrip ini telah menjadikannya sebagai sumber terbuka, sehingga para trader dapat meninjau dan memverifikasi fungsinya. Salut untuk penulisnya! Meskipun Anda dapat menggunakannya secara gratis, perlu diingat bahwa penerbitan ulang kode ini tunduk pada Tata Tertib kami.
Pernyataan Penyangkalan
Informasi dan publikasi ini tidak dimaksudkan, dan bukan merupakan, saran atau rekomendasi keuangan, investasi, trading, atau jenis lainnya yang diberikan atau didukung oleh TradingView. Baca selengkapnya di Ketentuan Penggunaan.
Skrip open-source
Dengan semangat TradingView yang sesungguhnya, pembuat skrip ini telah menjadikannya sebagai sumber terbuka, sehingga para trader dapat meninjau dan memverifikasi fungsinya. Salut untuk penulisnya! Meskipun Anda dapat menggunakannya secara gratis, perlu diingat bahwa penerbitan ulang kode ini tunduk pada Tata Tertib kami.
Pernyataan Penyangkalan
Informasi dan publikasi ini tidak dimaksudkan, dan bukan merupakan, saran atau rekomendasi keuangan, investasi, trading, atau jenis lainnya yang diberikan atau didukung oleh TradingView. Baca selengkapnya di Ketentuan Penggunaan.