OPEN-SOURCE SCRIPT
Diupdate Dynamic Gradient Filter
Sigmoid Functions:
[d1]History and Mathematical Basis:[/d1]
- Sigmoid functions have a rich history in mathematics and are widely used in various fields, including statistics, machine learning, and signal processing.
- The term "sigmoid" originates from the Greek words "sigma" (meaning "S-shaped") and "eidos" (meaning "form" or "type").
- The sigmoid curve is characterized by its smooth S-shaped appearance, which allows it to map any real-valued input to a bounded output range, typically between 0 and 1.
- The most common form of the sigmoid function is the logistic function:
[d1]Logistic Function (σ):[/d1]
- Defined as σ(x) = 1 / (1 + e^(-x)), where:
'x' is the input value,
'e' is Euler's number (approximately 2.71828).
- This function was first introduced by Belgian mathematician Pierre François Verhulst in the 1830s to model population growth with limiting factors.
- It gained popularity in the early 20th century when statisticians like Ronald Fisher began using it in regression analysis.
Specific Sigmoid Functions Used in the Indicator:
- sig(val):
The 'sig' function in this indicator is a modified version of the logistic function, clamping a value between 0 and 1 on the sigmoid curve.
- siga(val):
The 'siga' function adjusts values between -1 and 1 on the sigmoid curve, offering a centered variation of the sigmoid effect.
- sigmoid(val):
The 'sigmoid' function provides a standard implementation of the logistic function, calculating the sigmoid value of the input data.
Adaptive Smoothing Factor:
The 'adaptiveSmoothingFactor(gradient, k)' function computes a dynamic smoothing factor for the filter based on the gradient of the price data and the user-defined sensitivity parameter 'k'.
- Gradient:
The gradient represents the rate of change in price, calculated as the absolute difference between the current and previous close prices.
- Sensitivity (k):
The 'k' parameter adjusts how quickly the filter reacts to changes in the gradient. Higher values of 'k' lead to a more responsive filter, while lower values result in smoother outputs.
Usage in the Indicator:
The "close" value refers to the closing price of each period in the chart's time frame
- The indicator calculates the gradient by measuring the absolute difference between the current "close" price and the previous "close" price.
- This gradient represents the strength or magnitude of the price movement within the chosen time frame.
- The "close" value plays a pivotal role in determining the dynamic behavior of the "Dynamic Gradient Filter," as it directly influences the smoothing factor.
What Makes This Special:
The "Dynamic Gradient Filter" indicator stands out due to its adaptive nature and responsiveness to changing market conditions.
Dynamic Smoothing Factor:
- The indicator's dynamic smoothing factor adjusts in real-time based on the rate of change in price (gradient) and the user-defined sensitivity '(k)' parameter.
- This adaptability allows the filter to respond promptly to both minor fluctuations and significant price movements.
Smoothed Price Action:
- The final output of the filter is a smoothed representation of the price action, aiding traders in identifying trends and potential reversals.
Customizable Sensitivity:
- Traders can adjust the 'Sensitivity' parameter '(k)' to suit their preferred trading style, making the indicator versatile for various strategies.
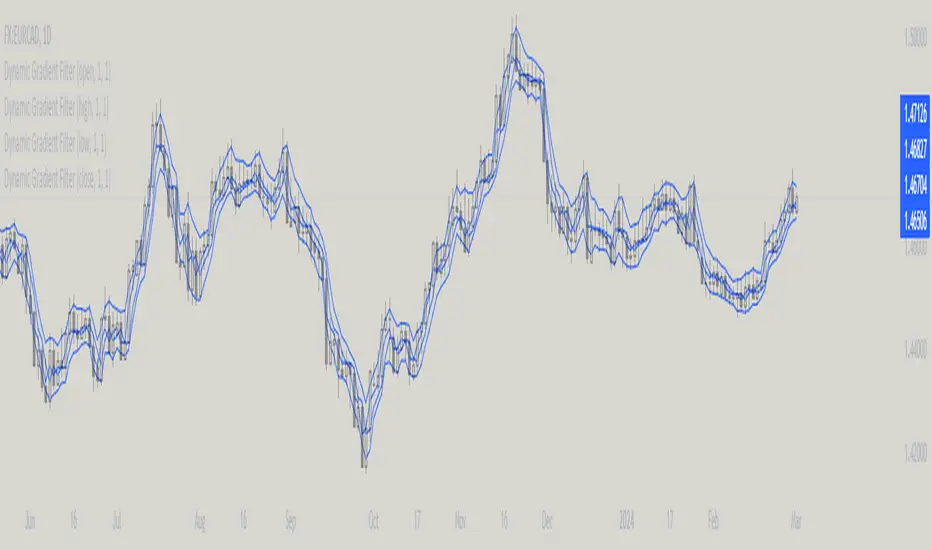
Visual Clarity:
- The plotted "Dynamic Gradient Filter" line on the chart provides a clear visual guide, enhancing the understanding of market dynamics.
Usage:
Traders and analysts can utilize the "Dynamic Gradient Filter" to:
- Identify trends and reversals in price movements.
- Filter out noise and highlight significant price changes.
- Fine-tune trading strategies by adjusting the sensitivity parameter.
- Enhance visual analysis with a dynamically adjusting filter line on the chart.
Literature:
- https://en.wikipedia.org/wiki/Pierre_Fran%C3%A7ois_Verhulst
- https://medium.com/in-maths-garden-with-julia/behind-the-logistic-function-47a8430a8f46
- https://en.wikipedia.org/wiki/Sigmoid_function
Catatan Rilis
minor adjustment tom = input.float(1, title="Multiplier",minval=0.01, maxval=10000, step=0.01)
Skrip open-source
Dengan semangat TradingView yang sesungguhnya, pembuat skrip ini telah menjadikannya sebagai sumber terbuka, sehingga para trader dapat meninjau dan memverifikasi fungsinya. Salut untuk penulisnya! Meskipun Anda dapat menggunakannya secara gratis, perlu diingat bahwa penerbitan ulang kode ini tunduk pada Tata Tertib kami.
Mupsje aka Casatropical
Pernyataan Penyangkalan
Informasi dan publikasi ini tidak dimaksudkan, dan bukan merupakan, saran atau rekomendasi keuangan, investasi, trading, atau jenis lainnya yang diberikan atau didukung oleh TradingView. Baca selengkapnya di Ketentuan Penggunaan.