OPEN-SOURCE SCRIPT
Diupdate Quantum Flow Tracker
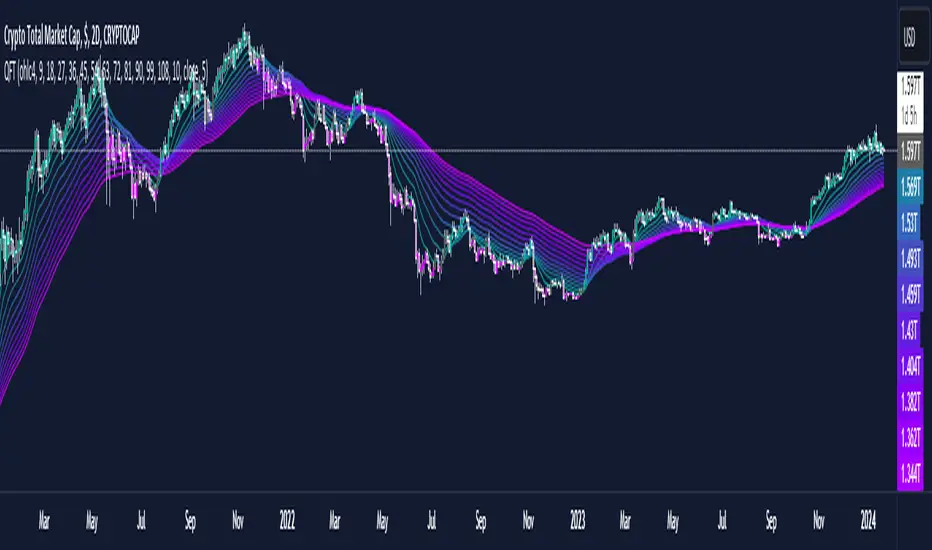
This indicator is designed to capture trends in financial markets by utilizing an Exponential Moving Average (EMA) and the Relative Strength Index (RSI).
Multiple EMAs
The indicator plots multiple EMAs with varying lengths on the chart. Users can customize the lengths of these EMAs using the input parameters.
RSI (Relative Strength Index)
The RSI is calculated based on user-defined length and source inputs.
Additionally, the RSI is smoothed using an Exponential Moving Average (EMA) with a customizable length.
Trend Conditions
The indicator defines uptrend and downtrend conditions based on the relationship between the closing price, the first EMA and the EMA of RSI .
An uptrend (Green Color) is identified when the closing price is above ema1 and the smoothed RSI is above 50.
A downtrend (Purple Color) is identified when the closing price is below ema1 and the smoothed RSI is below 50.
A neutral state (Gray Color) suggests that the trend may be weakening, potentially indicating a forthcoming trend reversal or a period of indecision in the market.
This indicator provides a visual representation of trend directions and can be customized to adjust the sensitivity and frequency of trend changes.
Disclaimer: This indicator is provided for educational and informational purposes only.
It is not intended as financial advice or as a tool for making financial decisions.
Users are advised to conduct their own research and seek the advice of a qualified financial professional before making any investment decisions. The creator of this indicator is not responsible for any financial losses incurred as a result of using this indicator.
Catatan Rilis
Default values for the EMAs error changed.Skrip open-source
Dengan semangat TradingView yang sesungguhnya, pembuat skrip ini telah menjadikannya sebagai sumber terbuka, sehingga para trader dapat meninjau dan memverifikasi fungsinya. Salut untuk penulisnya! Meskipun Anda dapat menggunakannya secara gratis, perlu diingat bahwa penerbitan ulang kode ini tunduk pada Tata Tertib kami.
🔍 Access Investing Strategies & Indicators
📊 whop.com/marktquant
🌐 marktquant.com
Nothing shared on this page constitutes financial advice. All information, tools, and analyses are provided solely for informational and educational purposes.
📊 whop.com/marktquant
🌐 marktquant.com
Nothing shared on this page constitutes financial advice. All information, tools, and analyses are provided solely for informational and educational purposes.
Pernyataan Penyangkalan
Informasi dan publikasi ini tidak dimaksudkan, dan bukan merupakan, saran atau rekomendasi keuangan, investasi, trading, atau jenis lainnya yang diberikan atau didukung oleh TradingView. Baca selengkapnya di Ketentuan Penggunaan.
Skrip open-source
Dengan semangat TradingView yang sesungguhnya, pembuat skrip ini telah menjadikannya sebagai sumber terbuka, sehingga para trader dapat meninjau dan memverifikasi fungsinya. Salut untuk penulisnya! Meskipun Anda dapat menggunakannya secara gratis, perlu diingat bahwa penerbitan ulang kode ini tunduk pada Tata Tertib kami.
🔍 Access Investing Strategies & Indicators
📊 whop.com/marktquant
🌐 marktquant.com
Nothing shared on this page constitutes financial advice. All information, tools, and analyses are provided solely for informational and educational purposes.
📊 whop.com/marktquant
🌐 marktquant.com
Nothing shared on this page constitutes financial advice. All information, tools, and analyses are provided solely for informational and educational purposes.
Pernyataan Penyangkalan
Informasi dan publikasi ini tidak dimaksudkan, dan bukan merupakan, saran atau rekomendasi keuangan, investasi, trading, atau jenis lainnya yang diberikan atau didukung oleh TradingView. Baca selengkapnya di Ketentuan Penggunaan.