OPEN-SOURCE SCRIPT
Diupdate Beyond Insights Indicator
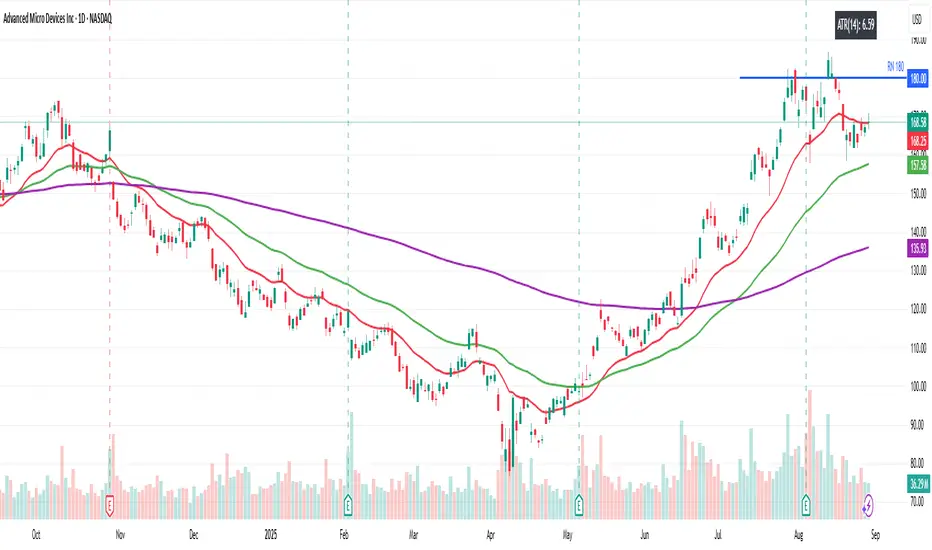
The Beyond Insights Indicator is a multi-timeframe overlay tool designed for TradingView that displays key Exponential Moving Averages (EMAs) and volatility insights to support various trading strategies. It intelligently adapts its display based on the current chart timeframe to reduce clutter and enhance relevance. Specifically, it shows EMA 6, 18, and 50 when viewing intraday timeframes.
In addition to EMAs, the indicator includes an ATR (Average True Range) calculation with a default length of 14, offering insight into market volatility.
In addition to EMAs, the indicator includes an ATR (Average True Range) calculation with a default length of 14, offering insight into market volatility.
Catatan Rilis
Purpose of the Script:When you switch between Monthly/Weekly/Daily charts, you only see the corresponding EMA20/50/200 lines (styled slightly differently to indicate the timeframe).
When you drop to any intraday chart (1 min, 5 min, 1 hour…), you instead see faster EMAs (6, 18, 50) suited to that shorter timeframe.
No matter which timeframe you’re on, there’s always a small overlay table in the top-right showing the current 14-period ATR reading.
The ATR reading in the corner gives you an immediate sense of current volatility without opening a separate indicator pane.
Catatan Rilis
Updated ATR to Two Decimal.Make the ATR more visible (Shifted to left)
Skrip open-source
Dengan semangat TradingView yang sesungguhnya, pembuat skrip ini telah menjadikannya sebagai sumber terbuka, sehingga para trader dapat meninjau dan memverifikasi fungsinya. Salut untuk penulisnya! Meskipun Anda dapat menggunakannya secara gratis, perlu diingat bahwa penerbitan ulang kode ini tunduk pada Tata Tertib kami.
Pernyataan Penyangkalan
Informasi dan publikasi ini tidak dimaksudkan, dan bukan merupakan, saran atau rekomendasi keuangan, investasi, trading, atau jenis lainnya yang diberikan atau didukung oleh TradingView. Baca selengkapnya di Ketentuan Penggunaan.