PROTECTED SOURCE SCRIPT
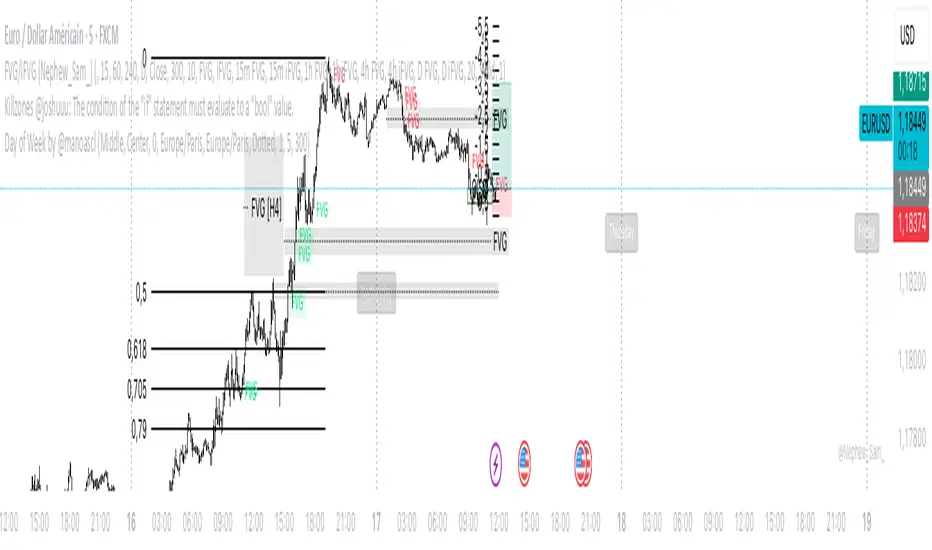
Day of Week by @manoascl
One-line summary
This indicator draws vertical lines and labels at 00:00 of your chosen timezone for selected weekdays, helping you see daily structure, spot recurring weekly patterns, and prepare for upcoming trading days.
What it does
Draws vertical lines at 00:00 (calendar midnight) of the selected timezone for chosen weekdays (Mon–Sun).
Optionally adds a weekday label at the start of the day (top/middle/bottom alignment) with a user-defined offset in minutes.
Maintains stable label Y-positions via a configurable lookback window.
Projects future day markers (up to 30) in the same style, optionally filtering to your selected weekdays.
Fully customizable visuals: line color/width/style (solid/dashed/dotted), label background and text colors, label anchoring.
How it works (concepts & calculations)
Day boundary (midnight): Computes dayStartTz = timestamp(timezone, year, month, day, 0, 0, 0) so the boundary is true calendar midnight for the selected TZ.
Day change detection: Uses ta.change(dayStartTz) != 0 to detect the first bar of a new day (non-repainting).
Weekday naming: Determines the weekday using a midday shift (+12h) to avoid edge effects near midnight.
Drawing: When the weekday passes your filter, draws a vertical line (high→low) and an optional label positioned at the start of the day.
Future projection (DST-safe): Rebuilds future markers with timestamp(timezone, Y, M, D + k, 0, 0, 0) so daylight-saving transitions don’t drift.
Stability: Top/middle/bottom label Y-levels are derived from ta.highest/ta.lowest over a user lookback, preventing jitter.
How to use it
Add the indicator to your chart.
In Timezone, pick your region (or choose Custom and type an IANA TZ like Pacific/Tahiti).
Select the weekdays to display (e.g., only trading days, highlight Mondays, etc.).
Choose label position (top/middle/bottom), anchor (left/center/right), and set a minute offset if you want labels slightly inside the day.
Enable future projection to see upcoming day starts for planning around key weekdays (FOMC Wednesdays, NFP Fridays).
Tweak line style/width and colors to match your chart theme.
Practical applications for traders
Intraday: Instantly see where each local-time day begins; segment your session analysis cleanly.
Swing: Emphasize recurring weekdays (e.g., Monday opens, Friday profit-taking).
Event-driven: Pre-mark news-heavy weekdays and preview them with future projection.
Pattern studies: Compare behavior by weekday (range expansion, reversals, gaps) with consistent local-time boundaries.
Limitations
Visual aid only; no trading signals are generated.
Timezone must be chosen explicitly; if you pick a TZ different from your chart’s display, lines will follow the selected TZ by design.
Market holidays and custom sessions are not detected; lines still mark calendar midnight even if the market is closed.
On very small timeframes and long histories, many objects can impact performance—reduce lookback or future count if needed.
This work is licensed under a Attribution-NonCommercial-ShareAlike 4.0 International (CC BY-NC-SA 4.0) creativecommons.org/licenses/by-nc-sa/4.0/
© manoascl
Skrip terproteksi
Skrip ini diterbitkan sebagai sumber tertutup. Namun, Anda dapat menggunakannya dengan bebas dan tanpa batasan apa pun – pelajari lebih lanjut di sini.
Pernyataan Penyangkalan
Informasi dan publikasi ini tidak dimaksudkan, dan bukan merupakan, saran atau rekomendasi keuangan, investasi, trading, atau jenis lainnya yang diberikan atau didukung oleh TradingView. Baca selengkapnya di Ketentuan Penggunaan.