OPEN-SOURCE SCRIPT
Dynamic Price Zone
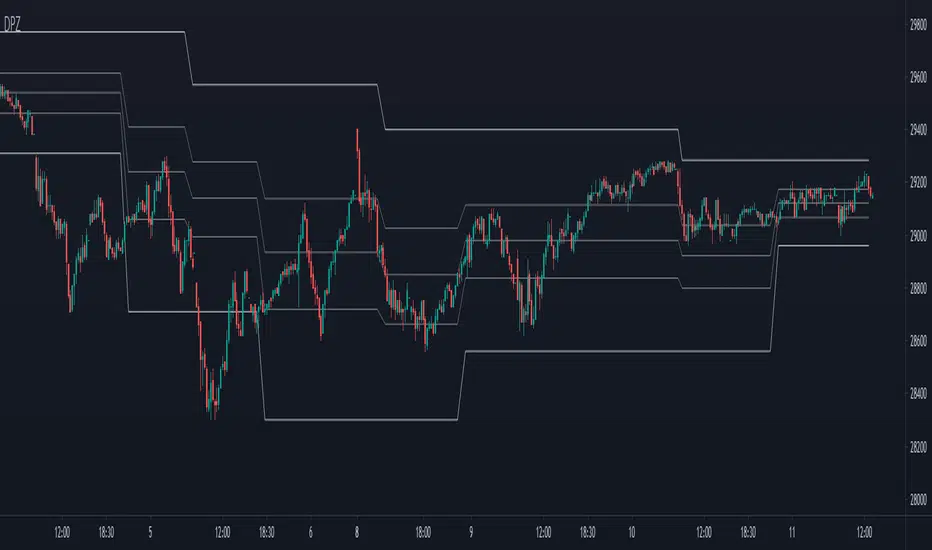
This indicator dynamically divides the price range into six zones.
1. Over Resistance (Strong up trend)
2. UpperMiddle to Resistance
3. Middle to UpperMiddle
4. Middle to LowerMiidle
5. LowerMiddle to Support
6. Under Support (Strong down Trend)
Resistance and Support are calculated by HMA.
Usage:
It is recommended to use this indicator on the higher time frames.
The image is 15 minutes chart and resolution 1hour for indicator.
- Pay attention to whether the range from resistance to support is shrinking or expanding!
- A major trend begins with a break in resistance and support.
- The five lines also work as a support or resistance.
- When the zone changes, the price is likely to reach the next line.
- UpperMiddle and LowerMiddle settings can be selected from 3 types.
- 75%, 66%, 61.8%(fibonacci) for UpperMiddle.
Skrip open-source
Dengan semangat TradingView yang sesungguhnya, pembuat skrip ini telah menjadikannya sebagai sumber terbuka, sehingga para trader dapat meninjau dan memverifikasi fungsinya. Salut untuk penulisnya! Meskipun Anda dapat menggunakannya secara gratis, perlu diingat bahwa penerbitan ulang kode ini tunduk pada Tata Tertib kami.
Pernyataan Penyangkalan
Informasi dan publikasi ini tidak dimaksudkan, dan bukan merupakan, saran atau rekomendasi keuangan, investasi, trading, atau jenis lainnya yang diberikan atau didukung oleh TradingView. Baca selengkapnya di Ketentuan Penggunaan.