OPEN-SOURCE SCRIPT
RSI Custom Levels

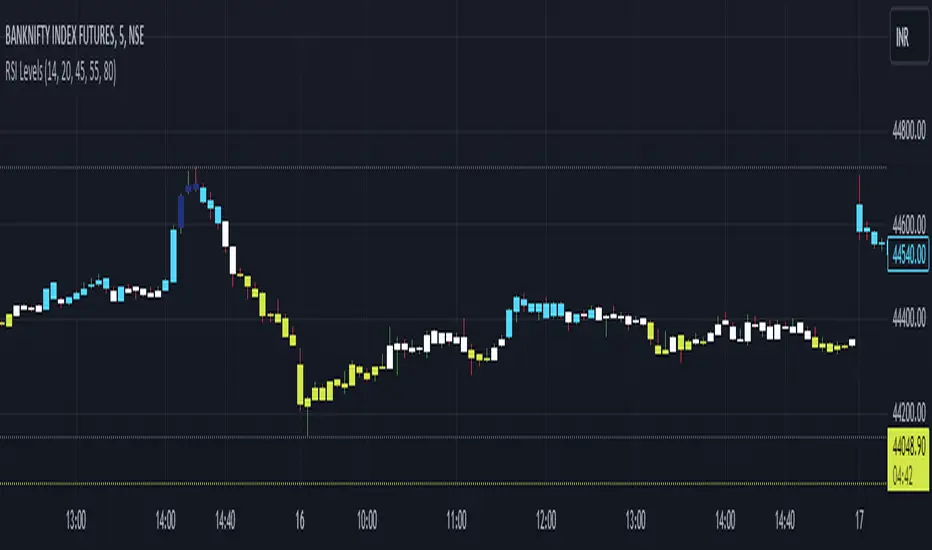
RSI Custom Levels is a "one stop shop" for a complete strategy based on RSI.
AS per principal: RSI oscillates between 0-100 and therefore the indicator is build around various parameters of RSI. It comprises of 4 different levels of RSI and therefore highlights the candles accordingly.
Understanding each LEVEL:
Level 1 (Highlight): Highlights candles that have an RSI value (closing basis) less than Level 1 specified value (default 20)
Level 2 (Highlight): Highlights candles that have an RSI value (closing basis) greater than Level 1 specified value (default 20) and less than Level 2 specified value (default 45)
Level 4 (Highlight): Highlights candles that have an RSI value (closing basis) greater than Level 4 specified value (default 80)
Level 3 (Highlight): Highlights candles that have an RSI value (closing basis) greater than Level 3 specified value (default 55) and less than Level 4 specified value (default 80)
The most efficient way to trade is as follows:
TRENDING SETUPS:
Uptrend Setups: When RSI enters Level 3 with exit at Level 4
Downtrend Setups: When RSI enters Level 2 with exit at Level 1
SIDEWAYS APPLICATION:
When RSI is in between Level 2 and 3 that area has no highlights as the system considers it to be FLAT and non oscillating.
OVERSTRETCHED APPLICATIONS:
Downtrend Reversal: When RSI enters Level 2 from Level 1 that is a sign for a downtrend reversal.
Uptrend Reversal: When RSI enters Level 3 from Level 2 that is a sign for a uptrend reversal.
Moreover the most ideal scenario is to convert the colour of all candles into white (in dark theme) or black(in light theme) for best performance.
Skrip open-source
Dengan semangat TradingView yang sesungguhnya, pembuat skrip ini telah menjadikannya sebagai sumber terbuka, sehingga para trader dapat meninjau dan memverifikasi fungsinya. Salut untuk penulisnya! Meskipun Anda dapat menggunakannya secara gratis, perlu diingat bahwa penerbitan ulang kode ini tunduk pada Tata Tertib kami.
Pernyataan Penyangkalan
Informasi dan publikasi ini tidak dimaksudkan, dan bukan merupakan, saran atau rekomendasi keuangan, investasi, trading, atau jenis lainnya yang diberikan atau didukung oleh TradingView. Baca selengkapnya di Ketentuan Penggunaan.