OPEN-SOURCE SCRIPT
Diupdate TRI - Quick Analysis
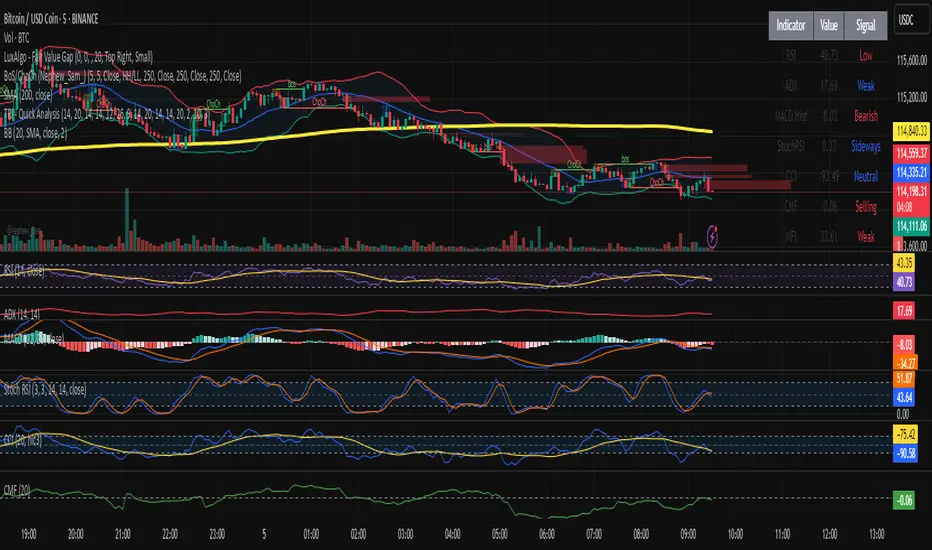
"TRI - Quick Analysis" is a multi-indicator dashboard designed to give traders an immediate overview of market momentum, trend strength, volume flow, and volatility.
It visually summarizes key technical indicators in a compact table, including:
Each value is color-coded (green, red, blue) based on whether it's favorable, unfavorable, or neutral for a potential long position.
At the bottom of the table, a summary score dynamically aggregates signals from all indicators and provides a simple trading score.
This tool is designed for discretionary traders looking for a quick, color-coded insight into current market conditions without relying on a single signal.
It visually summarizes key technical indicators in a compact table, including:
- RSI (momentum)
- MACD Histogram (trend momentum)
- ADX + SuperTrend (trend strength & direction)
- StochRSI (oversold/overbought)
- CCI (price deviation)
- CMF (volume flow)
- MFI (volume-weighted momentum)
- OBV (cumulative volume pressure)
- ATR (volatility)
- %B Bollinger (position within Bollinger Bands)
Each value is color-coded (green, red, blue) based on whether it's favorable, unfavorable, or neutral for a potential long position.
At the bottom of the table, a summary score dynamically aggregates signals from all indicators and provides a simple trading score.
This tool is designed for discretionary traders looking for a quick, color-coded insight into current market conditions without relying on a single signal.
Catatan Rilis
TRI - Quick Analysis is a multi-indicator dashboard designed to give traders an immediate overview of market momentum, trend strength, volume flow, and volatility.It visually summarizes key technical indicators in a compact table, including:
- RSI (momentum)
- MACD Histogram (trend momentum)
- ADX + SuperTrend (trend strength & direction)
- StochRSI (oversold/overbought)
- CCI (price deviation)
- CMF (volume flow)
- MFI (volume-weighted momentum)
- OBV (cumulative volume pressure)
- ATR (volatility)
- %B Bollinger (position within Bollinger Bands)
Each value is color-coded (green, red, blue) based on whether it's favorable, unfavorable, or neutral for a potential long position.
At the bottom of the table, a summary score dynamically aggregates signals from all indicators and provides a simple trading score.
This tool is designed for discretionary traders looking for a quick, color-coded insight into current market conditions without relying on a single signal.
Skrip open-source
Dengan semangat TradingView yang sesungguhnya, pembuat skrip ini telah menjadikannya sebagai sumber terbuka, sehingga para trader dapat meninjau dan memverifikasi fungsinya. Salut untuk penulisnya! Meskipun Anda dapat menggunakannya secara gratis, perlu diingat bahwa penerbitan ulang kode ini tunduk pada Tata Tertib kami.
Pernyataan Penyangkalan
Informasi dan publikasi ini tidak dimaksudkan, dan bukan merupakan, saran atau rekomendasi keuangan, investasi, trading, atau jenis lainnya yang diberikan atau didukung oleh TradingView. Baca selengkapnya di Ketentuan Penggunaan.