OPEN-SOURCE SCRIPT
Returns Stationarity Analysis (YavuzAkbay)

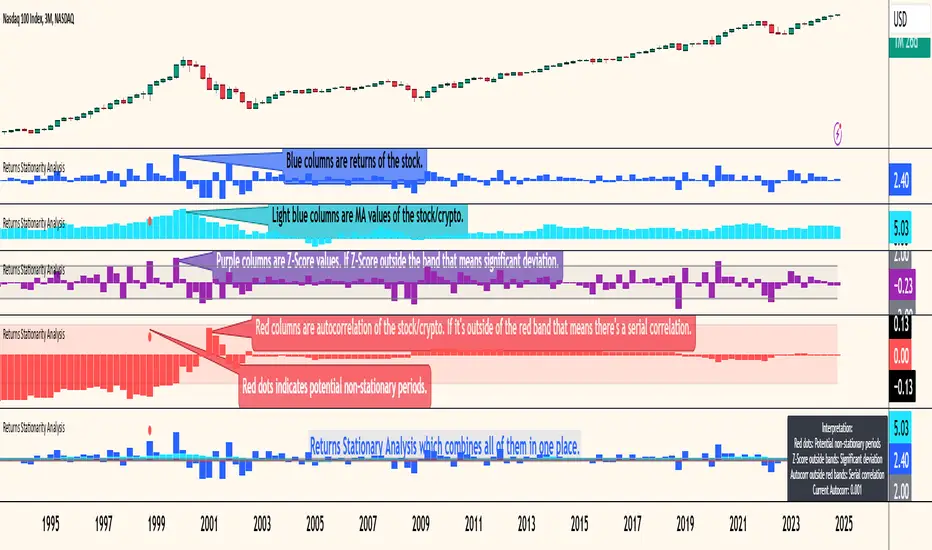
This indicator analyzes the stationarity of a stock's price returns over time. Stationarity is an important property of time series data, as it determines the validity of statistical analysis and forecasting methods.
The indicator provides several visual cues to help assess the stationarity of the price returns:
The indicator also includes the following features:
This indicator can be a useful tool for stock market analysts and traders to identify potential changes in the underlying dynamics of a stock's price behavior, which may have implications for forecasting, risk management, and investment strategies.
The indicator provides several visual cues to help assess the stationarity of the price returns:
- Price Returns: Displays the daily percentage change in the stock's closing price.
- Moving Average: Shows the smoothed trend of the price returns using a simple moving average.
- Z-Score: Calculates the standardized z-score of the price returns, highlighting periods of significant deviation from the mean.
- Autocorrelation: Plots the autocorrelation of the price returns, which measures the persistence or "memory" in the time series. High autocorrelation suggests non-stationarity.
The indicator also includes the following features:
- Customizable lookback period and smoothing window for the moving statistics.
- Lag parameter for the autocorrelation calculation.
- Shaded bands to indicate the significance levels for the z-score and autocorrelation.
- Visual signals (red dots) to highlight periods that are potentially non-stationary, based on a combination of high z-score and autocorrelation.
- Informative labels to guide the interpretation of the results.
This indicator can be a useful tool for stock market analysts and traders to identify potential changes in the underlying dynamics of a stock's price behavior, which may have implications for forecasting, risk management, and investment strategies.
Pernyataan Penyangkalan
Informasi dan publikasi tidak dimaksudkan untuk menjadi, dan bukan merupakan saran keuangan, investasi, perdagangan, atau rekomendasi lainnya yang diberikan atau didukung oleh TradingView. Baca selengkapnya di Persyaratan Penggunaan.