OPEN-SOURCE SCRIPT
Hosoda Waves ABCDE
The Hosoda Waves indicator was devised by Goichi Hosoda, who is also the creator of the Ichimoku system, with the idea that previous highs and lows could determine future price ranges that the market would react to.
Hosoda's projections are the NT, N, V, and E waves, which are derived from calculations based on both upward and downward ABC swings.
Hosoda's waves are derived from the following calculations:
NT Wave = C + (C - A)
N Wave = B + (B - A)
V Wave = B + (B - C)
E Wave = C + (B - A)
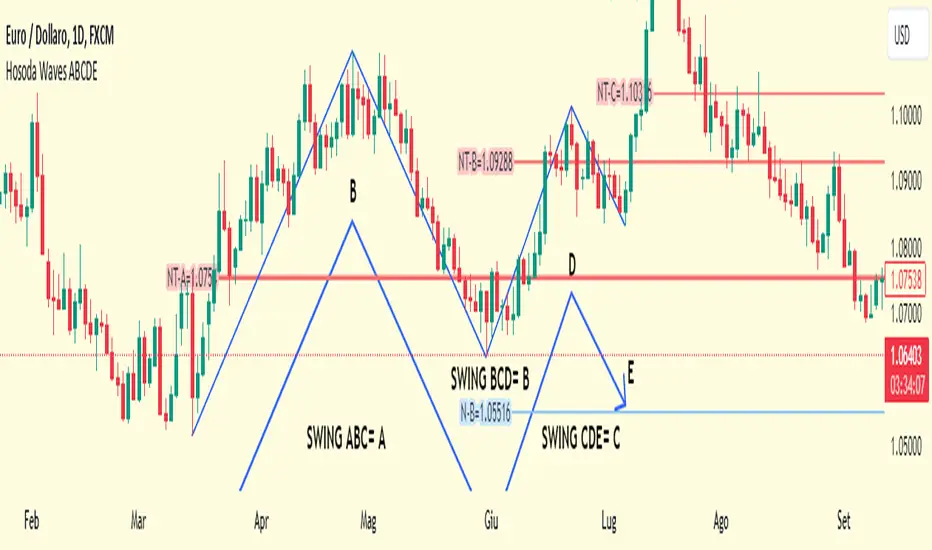
There are already scripts for the Hosoda waves, and my idea is to project an ABCDE swing simultaneously, meaning projecting three swings:
ABC, indicated with an A, resulting in NT-A, N-A, V-A, E-A.
BCD, indicated with a B, resulting in NT-B, N-B, V-B, E-B.
CDE, indicated with a C, resulting in NT-C, N-C, V-C, E-C.
Once the indicator is applied to the chart, the interactive Pine Script tool version 5 will prompt you to identify 5 points of "low-high-low-high-low" or "high-low-high-low-high," both for upward and downward movements and mixed.
Once clicked, these price points can be moved. If you change the time frame or market instrument, the indicator must be removed because it remains tied to the prices where it was initially drawn.
Hosoda's projections are the NT, N, V, and E waves, which are derived from calculations based on both upward and downward ABC swings.
Hosoda's waves are derived from the following calculations:
NT Wave = C + (C - A)
N Wave = B + (B - A)
V Wave = B + (B - C)
E Wave = C + (B - A)
There are already scripts for the Hosoda waves, and my idea is to project an ABCDE swing simultaneously, meaning projecting three swings:
ABC, indicated with an A, resulting in NT-A, N-A, V-A, E-A.
BCD, indicated with a B, resulting in NT-B, N-B, V-B, E-B.
CDE, indicated with a C, resulting in NT-C, N-C, V-C, E-C.
Once the indicator is applied to the chart, the interactive Pine Script tool version 5 will prompt you to identify 5 points of "low-high-low-high-low" or "high-low-high-low-high," both for upward and downward movements and mixed.
Once clicked, these price points can be moved. If you change the time frame or market instrument, the indicator must be removed because it remains tied to the prices where it was initially drawn.
Skrip open-source
Dengan semangat TradingView yang sesungguhnya, pembuat skrip ini telah menjadikannya sebagai sumber terbuka, sehingga para trader dapat meninjau dan memverifikasi fungsinya. Salut untuk penulisnya! Meskipun Anda dapat menggunakannya secara gratis, perlu diingat bahwa penerbitan ulang kode ini tunduk pada Tata Tertib kami.
Pernyataan Penyangkalan
Informasi dan publikasi ini tidak dimaksudkan, dan bukan merupakan, saran atau rekomendasi keuangan, investasi, trading, atau jenis lainnya yang diberikan atau didukung oleh TradingView. Baca selengkapnya di Ketentuan Penggunaan.