OPEN-SOURCE SCRIPT
Diupdate VOLUME HIGHLIGHTER PANEL (CUSTOM) [MaestroTrader]
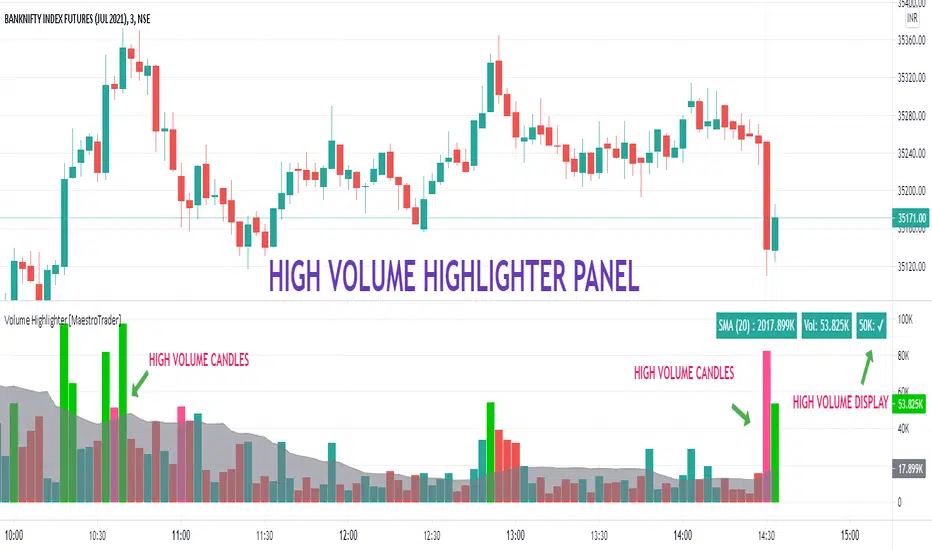
█ OVERVIEW
Volume highlighter panel provides volume insights to identify gradual increase or drop in volume or sudden volume urge that exceeds daily threshold.
It helps to determine the price behavior of the underlying Index/stock to make informed decisions while trading.
█ FEATURES
a) Displays Live SMA (20) Volume with color code. SMA Cells turns green if consecutive bar volume increases.
b) Live Volume Cell in table turns green if the volume is above average and turns red vice versa.
c) Threshold volume label appears when volume crosses the daily threshold limit.
Differences with the built-in version
This variation displays volume panel with additional volume insights for quick entry/exits.
█ SETTINGS
• Highlight Panel a) Configure Daily Volume Threshold b) configure Market session time c) Toggle highlighter on/Off d) Toggle Time on/Off (off) displays for whole period
• Volume Panel a) Configure SMA b) configure volume bar criteria c) configure Panel Display Location d) Toggle Volume Panel on/Off
█ IMPORTANT
Price always moves from trending to trading phase. Volume in Trending phase is generally high compared to volume in sideways phase. You need to identify the right volume threshold in each of the trading phases and change the settings accordingly.
█ BANKNIFTY /NIFTY VOLUME SETTINGS
BANKNIFTY - 3 MIN -50K volume
NIFTY - 3 MIN 125 K volume
Thanks to OSPL Siva for Nifty/Bank Nifty volumes. These volumes differ from trending phase & consolidation phase so adjust the threshold settings accordingly.

█ THANKS
Thanks a lot to Pine Team for this new great feature table & ‘format. Volume’ ! Thanks to Author=LucF, for the 'volume' logic.
█ DISCLIAMER
Indicator is built for educational purposes. Please test it thoroughly before you start using it.
You are free to use the code, please share the credit for reuse.
Hope - All these features help you get quick insights of the price movement to take the informed trades.
Happy Trading !!
Volume highlighter panel provides volume insights to identify gradual increase or drop in volume or sudden volume urge that exceeds daily threshold.
It helps to determine the price behavior of the underlying Index/stock to make informed decisions while trading.
█ FEATURES
a) Displays Live SMA (20) Volume with color code. SMA Cells turns green if consecutive bar volume increases.
b) Live Volume Cell in table turns green if the volume is above average and turns red vice versa.
c) Threshold volume label appears when volume crosses the daily threshold limit.
Differences with the built-in version
This variation displays volume panel with additional volume insights for quick entry/exits.
█ SETTINGS
• Highlight Panel a) Configure Daily Volume Threshold b) configure Market session time c) Toggle highlighter on/Off d) Toggle Time on/Off (off) displays for whole period
• Volume Panel a) Configure SMA b) configure volume bar criteria c) configure Panel Display Location d) Toggle Volume Panel on/Off
█ IMPORTANT
Price always moves from trending to trading phase. Volume in Trending phase is generally high compared to volume in sideways phase. You need to identify the right volume threshold in each of the trading phases and change the settings accordingly.
█ BANKNIFTY /NIFTY VOLUME SETTINGS
BANKNIFTY - 3 MIN -50K volume
NIFTY - 3 MIN 125 K volume
Thanks to OSPL Siva for Nifty/Bank Nifty volumes. These volumes differ from trending phase & consolidation phase so adjust the threshold settings accordingly.
█ THANKS
Thanks a lot to Pine Team for this new great feature table & ‘format. Volume’ ! Thanks to Author=LucF, for the 'volume' logic.
█ DISCLIAMER
Indicator is built for educational purposes. Please test it thoroughly before you start using it.
You are free to use the code, please share the credit for reuse.
Hope - All these features help you get quick insights of the price movement to take the informed trades.
Happy Trading !!
Catatan Rilis
Minor fixes for dark theme. Added RSI valueRSI background Color Coding
RSI >80 Overbought (light green)
RSI > 60 Bullish. (green)
RSI Between 40 to 50 , Neutral (gray)
RSI <40 Bearish (red)
RSI<20 Oversold(light red)
Catatan Rilis
Release Notes : Updated Volume Changes Icons. █ Volume Analysis Icons - Rising Volume, Falling Volume
Volume plays significant role in trend analysis.
1) Volume Rising , Price Rising - Bullish Trend
2) Volume Rising , Price Falling - Bearish Trend
3) Volume Falling, Price Rising - Momentum Exhaustion, Possible Bearish or Sideways Trend
4) Volume Falling, Price Falling- Momentum Exhaustion, Possible Bullish or Sideways Trend
https://www.tradingview.com/x/drchQDtJ/
Note: Use Volume Analysis as additional confirmation along with other trend analysis. Avoid low volume trades.
Happy Trading !!
Catatan Rilis
█
Update Fixed Volume with dynamic average volume
Usage : Choose High Volume as multiplier of normal volume i.e. default 2.5 , any volume exceeding 2.5 times volume of average look back(default 30) volumes will be highlighted with high volume color bar
Added Option to choose Symbol for volume display
Usage: Suppose you want to use future volume of one script on its Spot Chart you can do it by adding this indicator to spot chart and by choosing the future symbol in settings then selecting option 'Use New Symbol'
Example : Nifty Future Volume added on Nifty Spot Chart
https://www.tradingview.com/x/VejWpYrn/
Optimized Settings.
Added options for choosing colors, symbol, time period
Please inform me if you are using this code in any of your indicators ..
Happy Trading !!
Skrip open-source
Dengan semangat TradingView yang sesungguhnya, pembuat skrip ini telah menjadikannya sebagai sumber terbuka, sehingga para trader dapat meninjau dan memverifikasi fungsinya. Salut untuk penulisnya! Meskipun Anda dapat menggunakannya secara gratis, perlu diingat bahwa penerbitan ulang kode ini tunduk pada Tata Tertib kami.
Pernyataan Penyangkalan
Informasi dan publikasi ini tidak dimaksudkan, dan bukan merupakan, saran atau rekomendasi keuangan, investasi, trading, atau jenis lainnya yang diberikan atau didukung oleh TradingView. Baca selengkapnya di Ketentuan Penggunaan.