OPEN-SOURCE SCRIPT
Diupdate Supertrend with Stochastic OB/OS Arrows @KING
TradingView Idea: Supertrend with Stochastic Arrows KING
Overview:
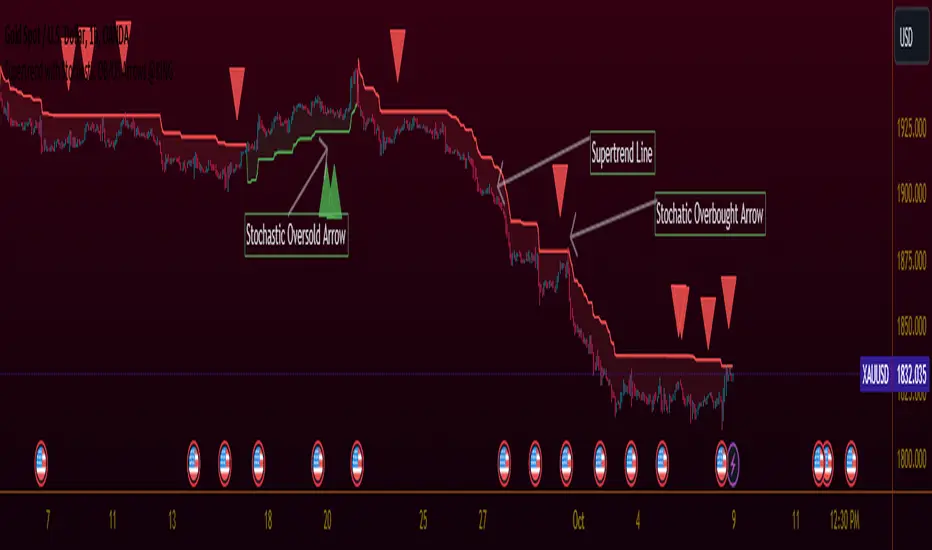
- Combining the Supertrend indicator with Stochastic arrows for a comprehensive market
view, providing insights into trend direction and potential reversal points.
Supertrend Settings:
- ATR Length: The length parameter for calculating the Average True Range (ATR).
- Factor: A multiplier used to determine the distance of the Supertrend line from the
price.
Supertrend Display:
* The Supertrend is color-coded:
- During an uptrend, it is displayed in green.
- During a downtrend, it is displayed in red.
- The body of the candlesticks is filled with color during the corresponding trend direction.
Stochastic Settings:
- K Length: The period length for the %K line in the Stochastic oscillator.
- K Smoothing: Smoothing factor for %K.
- D Smoothing: Smoothing factor for %D.
- Overbought Level: The threshold indicating an overbought condition.
- Oversold Level: The threshold indicating an oversold condition.
Arrows:
- Buy arrows are displayed below the bars during a downtrend when Stochastic is below the
oversold level.
- Sell arrows are displayed above the bars during an uptrend when Stochastic is above the
overbought level.
Supertrend Display:
- The Supertrend line is plotted with a color change based on its direction.
- The body of the candlesticks is filled with green during an uptrend and red during a downtrend.
Usage:
- Traders can use this script to identify potential entry and exit points, leveraging the
insights provided by both the Supertrend indicator and Stochastic oscillator. This
combination aims to capture trend strength and potential reversal opportunities.
Catatan Rilis
TradingView Idea: Supertrend with Stochastic Arrows KING
Overview:
- Combining the Supertrend indicator with Stochastic arrows for a comprehensive market view, providing insights into trend direction and potential reversal points.
Supertrend Settings:
- ATR Length: The length parameter for calculating the Average True Range (ATR).
- Factor: A multiplier used to determine the distance of the Supertrend line from the price.
Supertrend Display:
- The Supertrend is color-coded:
- During an uptrend, it is displayed in green.
- During a downtrend, it is displayed in red.
- The body of the candlesticks is filled with color during the corresponding trend direction.
Stochastic Settings:
- K Length: The period length for the %K line in the Stochastic oscillator.
- K Smoothing: Smoothing factor for %K.
- D Smoothing: Smoothing factor for %D.
- Overbought Level: The threshold indicating an overbought condition.
- Oversold Level: The threshold indicating an oversold condition.
Arrows:
- Buy arrows are displayed below the bars during a downtrend when Stochastic is below the oversold level.
- Sell arrows are displayed above the bars during an uptrend when Stochastic is above the overbought level.
Supertrend Display:
- The Supertrend line is plotted with a color change based on its direction.
- The body of the candlesticks is filled with green during an uptrend and red during a downtrend.
Usage:
- Traders can use this script to identify potential entry and exit points, leveraging the insights provided by both the Supertrend indicator and Stochastic oscillator. This combination aims to capture trend strength and potential reversal opportunities.
---
This format uses for bold and
Skrip open-source
Dengan semangat TradingView yang sesungguhnya, pembuat skrip ini telah menjadikannya sebagai sumber terbuka, sehingga para trader dapat meninjau dan memverifikasi fungsinya. Salut untuk penulisnya! Meskipun Anda dapat menggunakannya secara gratis, perlu diingat bahwa penerbitan ulang kode ini tunduk pada Tata Tertib kami.
Pernyataan Penyangkalan
Informasi dan publikasi ini tidak dimaksudkan, dan bukan merupakan, saran atau rekomendasi keuangan, investasi, trading, atau jenis lainnya yang diberikan atau didukung oleh TradingView. Baca selengkapnya di Ketentuan Penggunaan.