OPEN-SOURCE SCRIPT
Diupdate Round Numbers (Plotter) v2
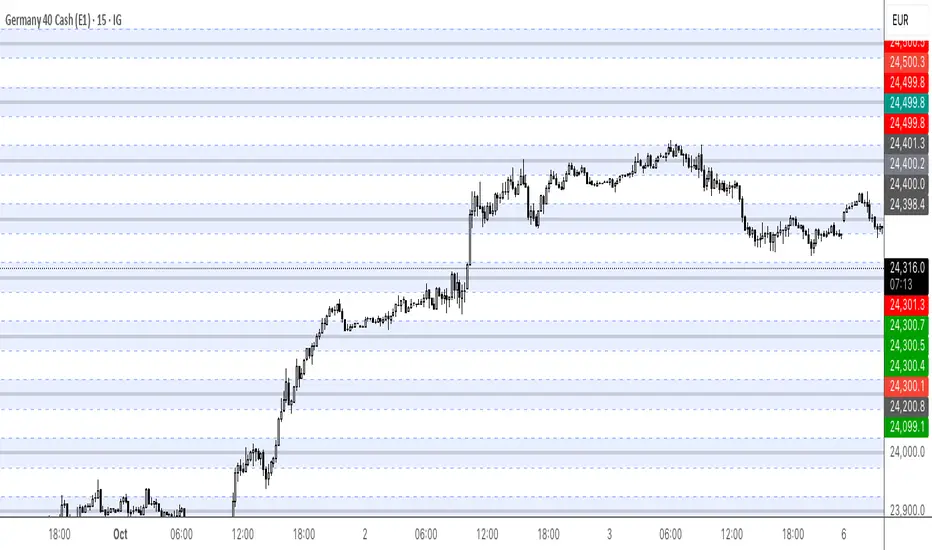
The *Round Numbers (Plotter) v2* indicator highlights key psychological price levels on the chart — the so-called *round numbers* (e.g. 1.1000 on EURUSD or23,000 on NASDAQ).
These levels often act as **natural support or resistance zones**, where price tends to react, consolidate, or reverse.
Version 2 introduces the concept of **gravitational zones**, which define a price range surrounding each round level — visualizing how price “gravitates” around these equilibrium areas.
---
### 🧩 **Main Features**
* 🔹 **Dynamic round levels:** plotted automatically based on user-defined *step size* (in points or pips).
* 🔹 **Custom step mode:** switch between “Points” (for indices, commodities, crypto) and “Pips” (for Forex pairs).
* 🔹 **Configurable appearance:** color, width, and line style (solid, dashed, dotted).
* 🔹 **Gravitation zones:** optional secondary lines plotted above and below each round level.
* Distance adjustable as a **percentage of the step size** (default = 25%).
* Help visualize “magnet areas” where price tends to slow down or oscillate before crossing a level.
* 🔹 **Optional fill:** softly shaded area between the upper and lower gravitation lines for clearer visualization of each zone.
* You can enable or disable this with the *“Show gravitation fill”* toggle.
* Fill color and transparency fully customizable.
---
### 📈 **Use Cases**
* Identify **psychological support/resistance** levels on any instrument or timeframe.
* Observe **market equilibrium zones** where price tends to cluster or hesitate before continuing.
* Combine with oscillators or volume indicators to confirm reaction strength near round numbers.
* Use the **gravitational zones** to refine stop-loss or take-profit placement near high-impact levels.
---
### 💡 **Notes**
* The indicator does **not repaint** and updates levels dynamically based on the latest price.
* Works on all asset classes: **Forex, Indices, Crypto, Commodities, Stocks.**
* Designed to be **lightweight** — no accumulation of historical objects.
* Combine this with *Round Number Analyzer* for complete analysis of round numbers level
Catatan Rilis
The Round Numbers (Plotter) v2 indicator highlights key psychological price levels on the chart — the so-called *round numbers* (e.g. 1.1000 on EURUSD or23,000 on NASDAQ).These levels often act as **natural support or resistance zones**, where price tends to react, consolidate, or reverse.
Version 2 introduces the concept of **gravitational zones**, which define a price range surrounding each round level — visualizing how price “gravitates” around these equilibrium areas.
---
### 🧩 **Main Features**
* 🔹 **Dynamic round levels:** plotted automatically based on user-defined *step size* (in points or pips).
* 🔹 **Custom step mode:** switch between “Points” (for indices, commodities, crypto) and “Pips” (for Forex pairs).
* 🔹 **Configurable appearance:** color, width, and line style (solid, dashed, dotted).
* 🔹 **Gravitation zones:** optional secondary lines plotted above and below each round level.
* Distance adjustable as a **percentage of the step size** (default = 25%).
* Help visualize “magnet areas” where price tends to slow down or oscillate before crossing a level.
* 🔹 **Optional fill:** softly shaded area between the upper and lower gravitation lines for clearer visualization of each zone.
* You can enable or disable this with the *“Show gravitation fill”* toggle.
* Fill color and transparency fully customizable.
---
### 📈 **Use Cases**
* Identify **psychological support/resistance** levels on any instrument or timeframe.
* Observe **market equilibrium zones** where price tends to cluster or hesitate before continuing.
* Combine with oscillators or volume indicators to confirm reaction strength near round numbers.
* Use the **gravitational zones** to refine stop-loss or take-profit placement near high-impact levels.
---
### 💡 **Notes**
* The indicator does **not repaint** and updates levels dynamically based on the latest price.
* Works on all asset classes: **Forex, Indices, Crypto, Commodities, Stocks.**
* Designed to be **lightweight** — no accumulation of historical objects.
* Combine this with *Round Number Analyzer* for complete analysis of round numbers level
Skrip open-source
Dengan semangat TradingView yang sesungguhnya, pembuat skrip ini telah menjadikannya sebagai sumber terbuka, sehingga para trader dapat meninjau dan memverifikasi fungsinya. Salut untuk penulisnya! Meskipun Anda dapat menggunakannya secara gratis, perlu diingat bahwa penerbitan ulang kode ini tunduk pada Tata Tertib kami.
Pernyataan Penyangkalan
Informasi dan publikasi ini tidak dimaksudkan, dan bukan merupakan, saran atau rekomendasi keuangan, investasi, trading, atau jenis lainnya yang diberikan atau didukung oleh TradingView. Baca selengkapnya di Ketentuan Penggunaan.