ProfitAlgo.io Backend Order Matrix (BOM) — Liquidity Mapping
How It Works
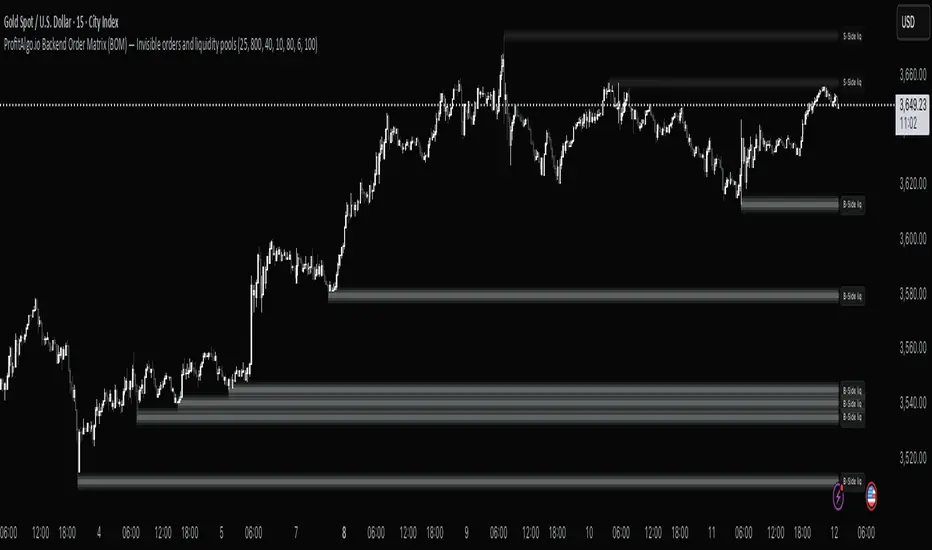
- Sell-Side Liquidity (above price): These areas often contain stop-loss orders from short sellers and breakout buy stops. When price trades into these zones, it may trigger rapid upward reversal.
- Buy-Side Liquidity (below price): These areas often contain stop-loss orders from long positions and breakout sell stops. When price trades into these zones, it may drive accelerated downside moves.
Sell-Side Liquidity Entries on Up Trends.
Example 1A
Example 1B
Example 1C
Sell-Side Liquidity Entries on Down Trends.
By projecting these zones directly on the chart, the BOM Indicator helps traders:
✔ Identify liquidity sweeps (stop hunts)
✔ Spot continuation setups following liquidity grabs
✔ Detect areas where reversals are likely to form
✔ Anticipate the “order flow magnets” that guide price
✨ Why It Matters
Price does not move randomly, it seeks liquidity. The BOM indicator makes this process visible by mapping out zones where orders are clustered. This gives traders a framework to align their strategies with institutional order flow and session dynamics.
Whether you trade intraday or higher timeframes, the Back End Order Matrix provides a structured framework to anticipate where the market is most likely to move next.
⚡ Important Note
It provides a structured method to project liquidity zones based on price behavior, session logic, and market structure order flow.
⚙️ Settings & Controls Guide – Back End Order Matrix
The Back End Order Matrix comes with adjustable settings so you can fine-tune how liquidity zones appear on different charts and timeframes. Each chart handles ticks differently naturally, so you may need to adjust values depending on the symbol and timeframe you’re analyzing.
Here’s what each setting does:
1. Layer Half Height (ticks)
- Controls the thickness of liquidity zones on the chart.
- Higher values = thicker liquidity zones.
- Lower values = thinner zones.
- ⚠️ Tip: On larger timeframes, increase this value (e.g., 500) to make zones clearly visible. On smaller timeframes, lower it (e.g., 50) so the zones don’t cover the entire screen.
2. Opacity Decay / Layer
- Determines how quickly each liquidity layer fades in transparency.
- Lower values = stronger, more solid gradients.
- Higher values = smoother, softer fading between layers.
- Default (6) creates a balanced layered gradient effect.
b]3. Gradient Layers
- Controls the number of gradient bands used to display the liquidity zone.
- Higher values = more layers, smoother transitions, and a “fuller” gradient effect.
- Lower values = fewer layers, more blocky appearance.
- Default (25) provides a good balance between clarity and performance, but will require to be changed based on chart ticker and/or timeframe.
4. Color Scheme
- Defines the color palette for Buy-Side vs Sell-Side liquidity zones.
- Typically, Buy-Side liquidity (above price) is shown in one gradient (e.g., light grey/white), while Sell-Side liquidity (below price) uses another (e.g., Dark Grey/Grey).
5. Transparency Controls
- Adjust the overall visibility of the gradient overlay.
- Useful for blending the matrix into the background or making it more pronounced depending on your chart style.
Skrip hanya-undangan
Hanya pengguna yang disetujui oleh penulis yang dapat mengakses skrip ini. Anda perlu meminta dan mendapatkan izin untuk menggunakannya. Izin ini biasanya diberikan setelah pembayaran. Untuk detail selengkapnya, ikuti petunjuk penulis di bawah ini atau hubungi PropFirmAlgo secara langsung.
Harap diperhatikan bahwa skrip pribadi khusus undangan ini belum ditinjau oleh moderator skrip, dan kepatuhannya terhadap Tata Tertib belum dipastikan. TradingView TIDAK menyarankan untuk membayar atau menggunakan skrip kecuali Anda sepenuhnya mempercayai pembuatnya dan memahami cara kerjanya. Anda juga dapat menemukan alternatif yang gratis dan sumber terbuka di skrip komunitas kami.
Instruksi penulis
Join Free Community: discord.gg/gFJAGF7gYc
All content provided by PropFirm Algo is for informational & educational purposes only. Past performance does not guarantee future results
Pernyataan Penyangkalan
Skrip hanya-undangan
Hanya pengguna yang disetujui oleh penulis yang dapat mengakses skrip ini. Anda perlu meminta dan mendapatkan izin untuk menggunakannya. Izin ini biasanya diberikan setelah pembayaran. Untuk detail selengkapnya, ikuti petunjuk penulis di bawah ini atau hubungi PropFirmAlgo secara langsung.
Harap diperhatikan bahwa skrip pribadi khusus undangan ini belum ditinjau oleh moderator skrip, dan kepatuhannya terhadap Tata Tertib belum dipastikan. TradingView TIDAK menyarankan untuk membayar atau menggunakan skrip kecuali Anda sepenuhnya mempercayai pembuatnya dan memahami cara kerjanya. Anda juga dapat menemukan alternatif yang gratis dan sumber terbuka di skrip komunitas kami.
Instruksi penulis
Join Free Community: discord.gg/gFJAGF7gYc
All content provided by PropFirm Algo is for informational & educational purposes only. Past performance does not guarantee future results