OPEN-SOURCE SCRIPT
Candle-Based Negative Space (Improved)
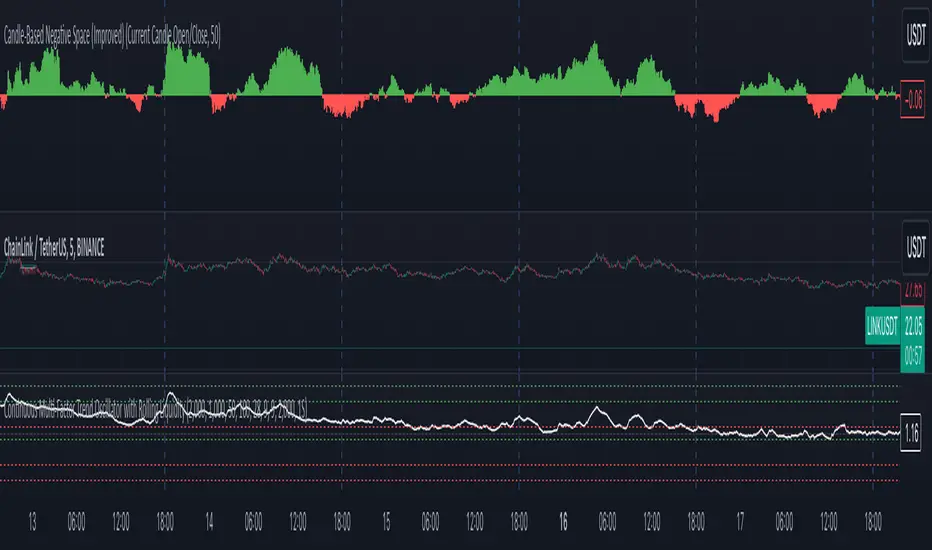
This script visualizes the concept of negative space (when a candle closes below a defined baseline) and positive space (when a candle closes above the baseline) on a price chart. It uses user-defined inputs to configure the baseline and optionally includes a moving average for additional trend analysis. Below is a detailed explanation of the script and suggestions for improving its plotting.
Explanation of the Script
Purpose
The script helps traders visualize the relationship between price movements and a dynamically chosen baseline. The baseline can be based on:
The high/low of the previous candle.
The open/close of the current candle.
The "negative space" is calculated when the closing price is below the baseline, and the "positive space" is calculated when the closing price is above the baseline. The sum of these spaces over a period is plotted as a histogram to provide insights into market strength.
Skrip open-source
Dengan semangat TradingView yang sesungguhnya, pembuat skrip ini telah menjadikannya sebagai sumber terbuka, sehingga para trader dapat meninjau dan memverifikasi fungsinya. Salut untuk penulisnya! Meskipun Anda dapat menggunakannya secara gratis, perlu diingat bahwa penerbitan ulang kode ini tunduk pada Tata Tertib kami.
Pernyataan Penyangkalan
Informasi dan publikasi ini tidak dimaksudkan, dan bukan merupakan, saran atau rekomendasi keuangan, investasi, trading, atau jenis lainnya yang diberikan atau didukung oleh TradingView. Baca selengkapnya di Ketentuan Penggunaan.