Bradley Siderograph
As Donald Bradley states in Stock Market Prediction:
"The siderograph is nothing more than a time chart showing a wavy line, which represents the algebraic total of the declination factor, the long terms, and the middle terms. It can be computed for any period—past or future—for which an ephemeris is available. Every aspect, whether long or middle term, is assigned a theoretical value of 10 at its peak. The value of the declination factor is half the algebraic sum of the given declinations of Venus and Mars, with northern declination considered positive and southern declination negative."
How the Bradley-Siderograph Works:
The Siderograph assigns positive and negative valencies based on the transits of inner and outer planets, categorized into long-term and mid-term aspects.
Each aspect (15° orb) is given a theoretical value, with the peak set at ±10. The approach and separation phases influence the weighting of each aspect leading up to its peak.
The sign of the valency depends on the type of aspect:
Squares and oppositions are assigned negative values
Trines and sextiles are assigned positive values
Conjunctions can be either positive or negative, depending on the planetary combination
Formula Used:
The Siderograph is computed as follows:
𝑃 = 𝑋 (𝐿 + 𝐷) + 𝑀
Where:
P = Sidereal Potential (final computed value)
X = Multiplier (to weight long-term aspects)
L = Long-term aspects (10 aspect combinations)
D = Declination factor (half the sum of Venus and Mars declinations)
M = Mid-term aspects
The long-term component (L + D) can be multiplied by a chosen factor (X) to emphasize its influence relative to the mid-term aspects.
How to Use the Indicator:
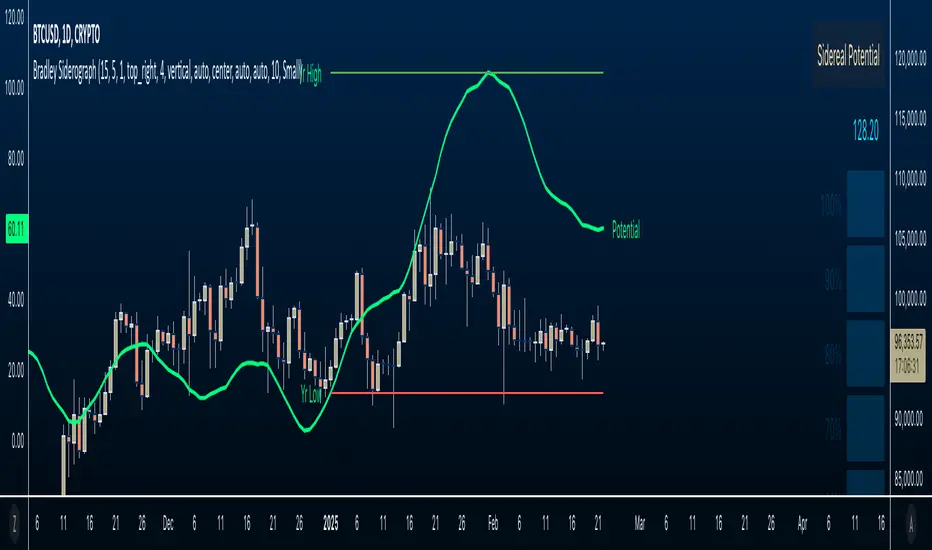
Once applied, the Siderograph line overlays on the chart, using the left-side scale for reference.
The indicator provides separate plots for:
Sidereal potential
Long-term aspects
Mid-term aspects
Declination factor
Each component can be toggled on or off for deeper analysis.
Gauges "provided by faiyaz7283 library" display the high and low range for each curve, allowing quick identification of extreme values.
The indicator also marks the yearly high and low of the current year’s sidereal potential, providing a reference for when the market is trading above or below key levels. This feature was inspired by an observation made by Bradley in his book, which I wanted to incorporate here.
Users can fully customize the indicator by:
Switching between geocentric and heliocentric views.
Adjusting the orb of planetary transits to refine aspect sensitivity.
Multiplier (to weight long-term aspects)
Explore the Bradley-Siderograph and experiment with its settings.
Main Use Case
The Siderograph can be thought of as a psychological wind sock, gauging shifts in mass sentiment in response to planetary influences. Rather than forecasting market direction outright, it serves as an early warning system, signaling when conditions may be primed for changes in collective psychology.
As Donald Bradley notes in Stock Market Prediction:
"A limitation of the siderograph is that it cannot be construed as a forecast of secular trend. In statistical terminology, 'lines of regression' fitted to the market course and to the potential should not be expected to completely agree, for reasons obvious to everybody with keen business sense or commercial training. However, the siderograph may be depended upon to reward its analyst with foreknowledge of coming conditions in general, so that the non-psychological factors may be evaluated accordingly. By this, we mean that the potential will afford one with clues as to how the mass mind will 'take' the other mechanical or governmental vicissitudes affecting high finance. The siderograph may be thought of as a principle 'symptom' in diagnosing current market circumstances and as a sounding-board for prognoses concerning further developments."
Planned Improvement:
While Bradley did not construct the Siderograph for direct forecasting, an enhancement to this indicator would be the ability to project each curve forward in time, providing a clearer view of how upcoming planetary aspects.
This indicator is being released as open source with the hope of further refining and expanding its capabilities—particularly in developing future plots that improve visualization and analysis. Contributions and feedback are encouraged to enhance its usability and advance the study of planetary influences in market behavior.
Credits & Acknowledgments:
Inspired by Donald Bradley and his work in Stock Market Prediction: The Planetary Barometer and How to Use It.
Built using Astrolib, developed by BarefootJoey
Built using Gauges, developed by faiyaz7283
Skrip open-source
Dengan semangat TradingView yang sesungguhnya, penulis skrip ini telah menjadikannya sumber terbuka, sehingga para trader dapat meninjau dan memverifikasi fungsinya. Hormat untuk penulisnya! Meskipun anda dapat menggunakannya secara gratis, ingatlah bahwa penerbitan ulang kode tersebut tunduk pada Tata Tertib kami.
Untuk akses cepat pada chart, tambahkan skrip ini ke favorit anda — pelajari lebih lanjut di sini.
Pernyataan Penyangkalan
Skrip open-source
Dengan semangat TradingView yang sesungguhnya, penulis skrip ini telah menjadikannya sumber terbuka, sehingga para trader dapat meninjau dan memverifikasi fungsinya. Hormat untuk penulisnya! Meskipun anda dapat menggunakannya secara gratis, ingatlah bahwa penerbitan ulang kode tersebut tunduk pada Tata Tertib kami.
Untuk akses cepat pada chart, tambahkan skrip ini ke favorit anda — pelajari lebih lanjut di sini.