OPEN-SOURCE SCRIPT
Diupdate Relative Strength Comparator
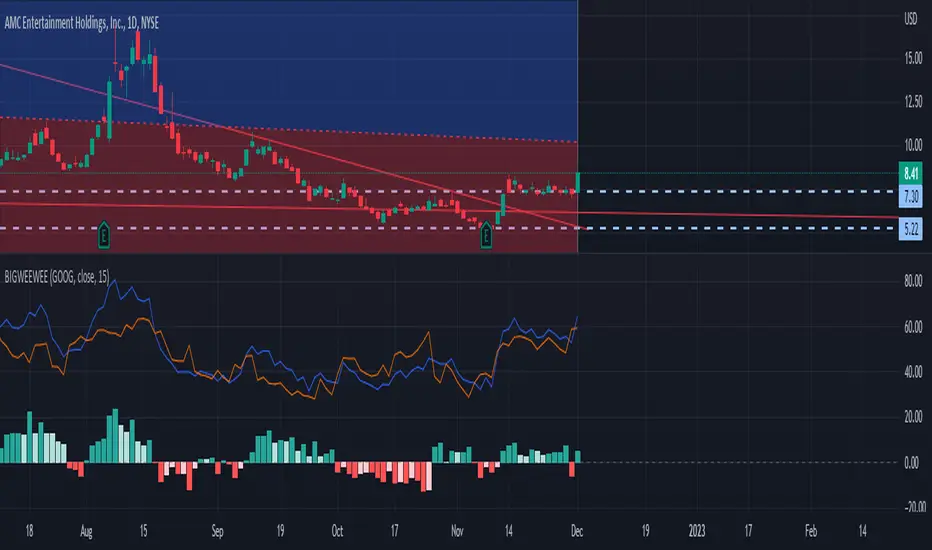
Basically just plots the RSI and the RSI of another stock you pick. Then subtracts the two and makes a histogram showing who's winning.
Catatan Rilis
Fixed some of the names because yes I did copy paste from a MACD indicator.Catatan Rilis
its the big weewee 2.0Yellow line is macd histogram of your stonk - the macd histogram of the stonk you select.
Skrip open-source
Dengan semangat TradingView yang sesungguhnya, pembuat skrip ini telah menjadikannya sebagai sumber terbuka, sehingga para trader dapat meninjau dan memverifikasi fungsinya. Salut untuk penulisnya! Meskipun Anda dapat menggunakannya secara gratis, perlu diingat bahwa penerbitan ulang kode ini tunduk pada Tata Tertib kami.
Pernyataan Penyangkalan
Informasi dan publikasi ini tidak dimaksudkan, dan bukan merupakan, saran atau rekomendasi keuangan, investasi, trading, atau jenis lainnya yang diberikan atau didukung oleh TradingView. Baca selengkapnya di Ketentuan Penggunaan.