PROTECTED SOURCE SCRIPT
SePeT TaKiP v1
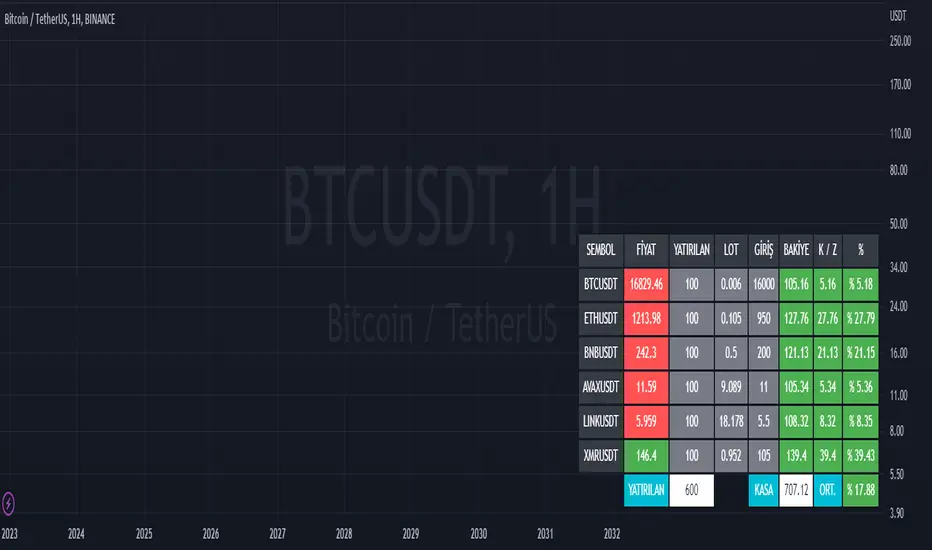
It has been prepared with the aim of keeping track of your medium and long term baskets.
A total of 10 Symbols can be added.
Symbols can be changed in settings. In order for the symbol to appear in the table, you must fill in the "entry price" and "deposited amount" boxes.
In addition, in the Commission box, you must enter the amount of commission applied to you by the exchange you are a member of.
If you do not want to see the table on your screen all the time, when you select the "Reduce/Enlarge Table" option, you can see the information table in the form of Deposit, Current Amount and Profit Loss percentage in the upper right corner of the graph.
If you don't want a symbol to appear on the chart anymore, you must enter "0" in the entry price and stake boxes.
TURKISH INFORMATION
Orta ve Uzun vade sepetlerinizi takip edebilmeniz amacı ile hazırlanmıştır.
Toplamda 10 Sembol eklenebilir.
Ayarlardan semboller değiştirilebilir. Sembolün tabloda görünebilmesi için "giriş fiyatı" ve "yatırılan tutar" kutucuklarını doldurmanız gerekir.
Ayrıca Komisyon kutucuğundan üye olduğunuz borsanın tarafınıza uyguladığı komisyon miktarını girmeniz gerekir.
Eğer ki bir sembolün artık tabloda görünmesini istemiyorsanız, giriş fiyatı ve yatırılan tutar kutucuklarına "0" değerini yazmanız gerekir
Tabloyu sürekli ekranınızda görmek istemezseniz "Tabloyu Küçült/Büyüt" seçeneğini işaretlediğiniz zaman grafiğin sağ üst köşesinde Yatırılan tutar, Güncel Tutar ve Kar zarar yüzdesi şeklinde bilgilendirme tablosu görebilirsiniz.
Skrip terproteksi
Skrip ini diterbitkan sebagai sumber tertutup. Namun, Anda dapat menggunakannya dengan bebas dan tanpa batasan apa pun – pelajari lebih lanjut di sini.
Pernyataan Penyangkalan
Informasi dan publikasi ini tidak dimaksudkan, dan bukan merupakan, saran atau rekomendasi keuangan, investasi, trading, atau jenis lainnya yang diberikan atau didukung oleh TradingView. Baca selengkapnya di Ketentuan Penggunaan.