OPEN-SOURCE SCRIPT
Bubble Risk Indicator
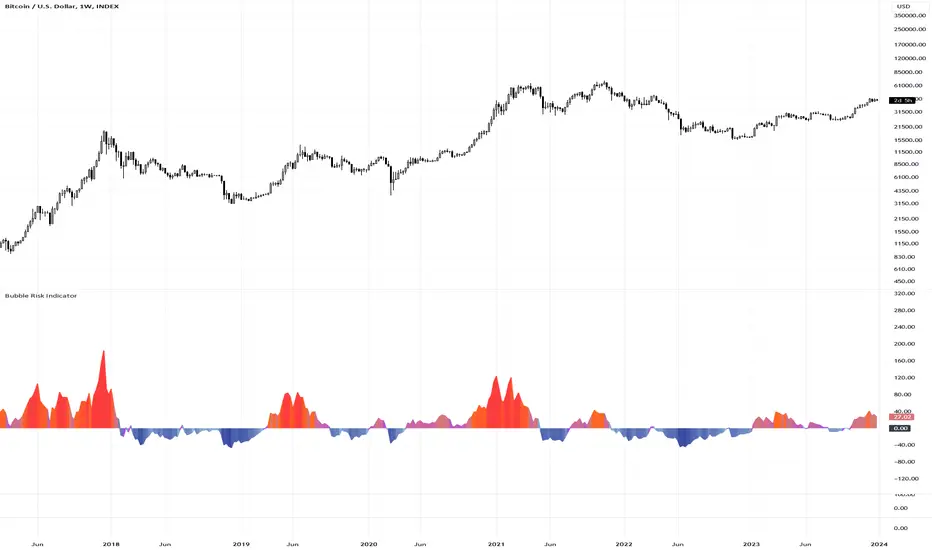
The Bubble Risk Indicator is a sophisticated tool designed to assess the potential risk level of a trading instrument by measuring its deviation from a 20-week Simple Moving Average (SMA). This dynamic indicator visually represents the deviation with a color-changing line, indicating the degree of risk based on the distance from the SMA.

🔷 Calculation
The indicator calculates the deviation from the 20-week SMA and expresses it as a percentage extension:
🔷 Color Coding
The line changes color based on the deviation level to represent different risk levels. Users can customize these colors as per their preferences. However, the following are the default recommended settings:
Colors transition smoothly to reflect the increasing or decreasing risk based on the deviation from the SMA.

🔷 Customization
Users have the flexibility to change the colors representing each risk level through the indicator settings. While the default colors are recommended for a standard view, users comfortable with custom color schemes can adjust according to their preference.
🔷 Usage
This indicator is beneficial for gauging the relative risk associated with current price movements compared to a historical average. It's most effective when used in conjunction with other technical analysis tools and market knowledge.
🔷 Limitations
While the Bubble Risk Indicator provides valuable insights, it should form part of a broader trading strategy. It assesses risk levels based on historical data and does not predict future market directions.
🔷 Conclusion
The Bubble Risk Indicator offers a nuanced and visually intuitive way to understand market risk levels, providing traders with an additional tool for informed decision-making.
🔷 Risk Disclaimer
Trading involves significant risk and is not suitable for every investor. The value of investments can fluctuate. Past performance is not indicative of future results. Always consider your circumstances and seek independent advice before making financial decisions. This indicator is provided for informational purposes only and is not intended as financial advice.
🔷 Calculation
The indicator calculates the deviation from the 20-week SMA and expresses it as a percentage extension:
- 20-Week SMA: Averages the closing prices over the past 20 periods, providing a consistent measure of the long-term trend.
- Deviation Percentage: Measures the percentage difference between the current closing price and the 20-week SMA.
🔷 Color Coding
The line changes color based on the deviation level to represent different risk levels. Users can customize these colors as per their preferences. However, the following are the default recommended settings:
- Extreme Low Risk (Below 0): Blue
- Low Risk (Below 0): Light Blue
- Low Risk (Above 0): Light Purple
- Medium Risk: Orange
- High Risk: Red
Colors transition smoothly to reflect the increasing or decreasing risk based on the deviation from the SMA.
🔷 Customization
Users have the flexibility to change the colors representing each risk level through the indicator settings. While the default colors are recommended for a standard view, users comfortable with custom color schemes can adjust according to their preference.
🔷 Usage
This indicator is beneficial for gauging the relative risk associated with current price movements compared to a historical average. It's most effective when used in conjunction with other technical analysis tools and market knowledge.
🔷 Limitations
While the Bubble Risk Indicator provides valuable insights, it should form part of a broader trading strategy. It assesses risk levels based on historical data and does not predict future market directions.
🔷 Conclusion
The Bubble Risk Indicator offers a nuanced and visually intuitive way to understand market risk levels, providing traders with an additional tool for informed decision-making.
🔷 Risk Disclaimer
Trading involves significant risk and is not suitable for every investor. The value of investments can fluctuate. Past performance is not indicative of future results. Always consider your circumstances and seek independent advice before making financial decisions. This indicator is provided for informational purposes only and is not intended as financial advice.
Skrip open-source
Dengan semangat TradingView yang sesungguhnya, pembuat skrip ini telah menjadikannya sebagai sumber terbuka, sehingga para trader dapat meninjau dan memverifikasi fungsinya. Salut untuk penulisnya! Meskipun Anda dapat menggunakannya secara gratis, perlu diingat bahwa penerbitan ulang kode ini tunduk pada Tata Tertib kami.
Pernyataan Penyangkalan
Informasi dan publikasi ini tidak dimaksudkan, dan bukan merupakan, saran atau rekomendasi keuangan, investasi, trading, atau jenis lainnya yang diberikan atau didukung oleh TradingView. Baca selengkapnya di Ketentuan Penggunaan.