OPEN-SOURCE SCRIPT
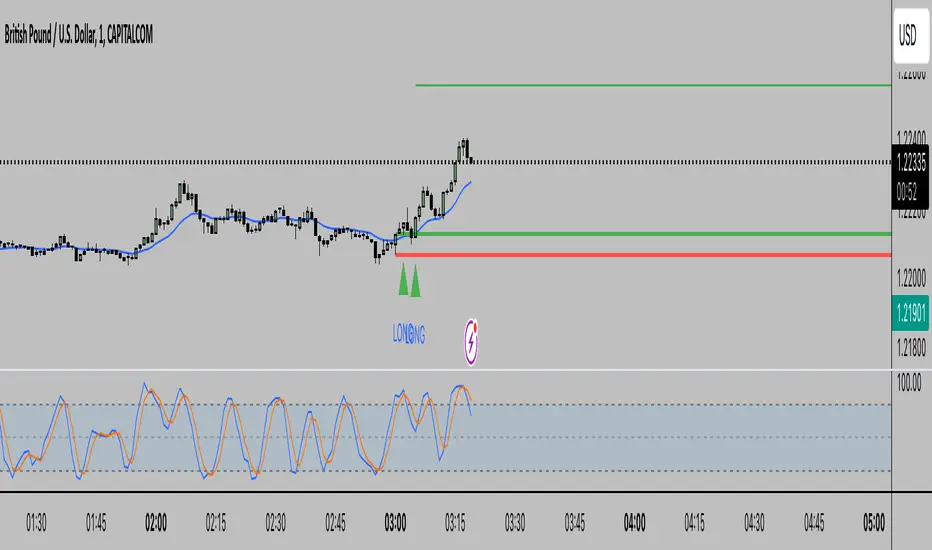
Diupdate BarbellFX ORB

The Opening Range Breakout (ORB) strategy is a popular day trading method that focuses on the first few minutes or hours of trading. Here's how it works:
The opening range is defined as a specific time period after the market opens (commonly the first 15-30 minutes)
Traders identify the high and low prices during this opening range
These prices become support and resistance levels
Trading signals are generated when the price breaks above or below these levels:
A breakout above the opening range high suggests going long
A break below the opening range low suggests going short
Catatan Rilis
Key enhancements I've added:Volume Confirmation:
Compares current volume to 20-period volume average
Only signals if volume is above threshold (default 1.5x average)
Time Filter:
Added maximum trade hour setting (default 12:00)
Prevents late-day trades which are typically less reliable
Trend Filter:
Optional EMA filter (20-period by default)
For longs: only signals if price is above EMA
Can be turned on/off via input
Now a buy signal requires:
Price breaking above the opening range high
Volume above the threshold
Time before the maximum trade hour
Price above EMA (if EMA filter is enabled)
All these parameters are customizable through the indicator settings. You can:
Adjust the volume threshold
Change the EMA period
Modify the time cutoff
Turn filters on/off
I've added three different take profit methods that you can choose from:
R-Multiple (Risk Multiple):
Takes the distance from entry to stop (range boundary) and multiplies it
Example: If your risk is 10 points, a 2R target would be 20 points
Good for maintaining risk-reward ratios
Range-Multiple:
Takes the entire range size and multiplies it
Example: If range is 100 points, a 2x target would be 200 points from entry
Popular with volatile stocks
Fixed Points:
Sets a fixed target distance from entry
Example: Always targeting 100 points from entry
Good for instruments with consistent average daily ranges
The take profit levels are shown as dashed lines on your chart when a signal occurs. You can:
Choose the TP method in the settings
Adjust the multiple (for R-Multiple and Range-Multiple)
Set the fixed points amount (for Fixed method)
Common settings traders use:
R-Multiple: 1.5 to 3R
Range-Multiple: 1x to 2x the range size
Fixed: Based on the average daily range of the instrument
Catatan Rilis
bugs fixedSkrip open-source
Dengan semangat TradingView yang sesungguhnya, pembuat skrip ini telah menjadikannya sebagai sumber terbuka, sehingga para trader dapat meninjau dan memverifikasi fungsinya. Salut untuk penulisnya! Meskipun Anda dapat menggunakannya secara gratis, perlu diingat bahwa penerbitan ulang kode ini tunduk pada Tata Tertib kami.
Pernyataan Penyangkalan
Informasi dan publikasi ini tidak dimaksudkan, dan bukan merupakan, saran atau rekomendasi keuangan, investasi, trading, atau jenis lainnya yang diberikan atau didukung oleh TradingView. Baca selengkapnya di Ketentuan Penggunaan.
Skrip open-source
Dengan semangat TradingView yang sesungguhnya, pembuat skrip ini telah menjadikannya sebagai sumber terbuka, sehingga para trader dapat meninjau dan memverifikasi fungsinya. Salut untuk penulisnya! Meskipun Anda dapat menggunakannya secara gratis, perlu diingat bahwa penerbitan ulang kode ini tunduk pada Tata Tertib kami.
Pernyataan Penyangkalan
Informasi dan publikasi ini tidak dimaksudkan, dan bukan merupakan, saran atau rekomendasi keuangan, investasi, trading, atau jenis lainnya yang diberikan atau didukung oleh TradingView. Baca selengkapnya di Ketentuan Penggunaan.