Volume Spike | viResearch
Conceptual Foundation and Innovation
The Volume Spike indicator by viResearch is designed to identify the underlying strength and health of market participation by analyzing volume behavior. Rather than simply detecting high or low volume, this indicator distinguishes between healthy, gradual accumulation and unsustainable volume surges, giving traders a nuanced understanding of market sentiment.
The indicator focuses on the relationship between current trading volume and its moving average, classifying market activity into several key regimes — gradual, consistent, spiking, or weakening. This allows traders to quickly assess whether a price move is supported by solid participation or driven by temporary excitement that may not last.
Core Concept and Analysis Approach
At its core, Volume Spike measures the quality and consistency of trading activity over time. When volume rises steadily and remains within a stable range, it reflects healthy participation and sustainable trends. In contrast, when volume suddenly surges several times above average, it may indicate a climax move, often preceding a short-term top or bottom.
The indicator also incorporates consistency and trend assessments to evaluate whether current volume conditions align with accumulation, distribution, or exhaustion phases — helping traders interpret why a move is happening, not just that it is.
Features and User Inputs
The Volume Spike script includes several key parameters that allow traders to tailor its behavior to different assets and timeframes:
Volume Average Length: Defines the lookback period for calculating the average volume baseline.
Spike Multiplier: Sets the threshold (in multiples of the average) to define a true “spike” in volume.
Gradual Max Multiplier: Determines the upper limit of what is considered healthy, gradual volume growth.
Consistency Check Period: Evaluates how stable or erratic recent volume behavior has been.
Volume MA & EMA Display: Optional overlays for visual comparison against current activity.
These settings allow traders to distinguish between normal volume growth during trend formation and excessive spikes that often signal exhaustion or reversal risk.
Market Interpretation and Use Cases
The Volume Spike indicator provides valuable insights into market conditions, particularly during strong price movements or breakout phases. It can be used to:
Identify Healthy Trend Participation: Gradually rising volume within consistent ranges confirms genuine trend momentum.
Detect Volume Climax Events: Sudden spikes far above the average often mark exhaustion points, signaling caution.
Spot Divergences: When price rises but volume weakens, it can indicate a fading rally or distribution phase.
Evaluate Accumulation vs. Distribution: Volume patterns during down moves reveal whether smart money is buying weakness or selling strength.
Visual Cues and Color Logic
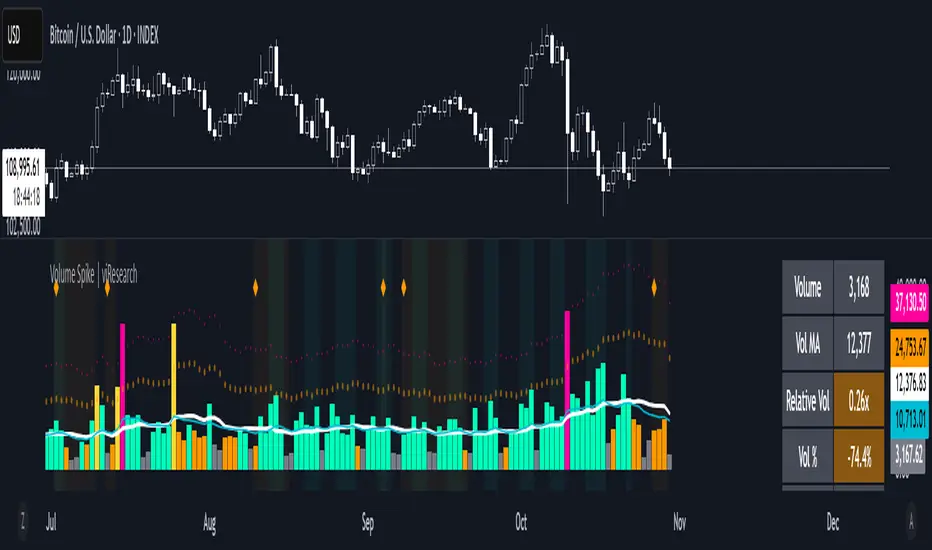
The indicator uses intuitive color coding to make volume interpretation straightforward:
Aqua (Healthy Gradual Volume): Stable, sustainable participation supporting trend continuation.
Pink (Volume Spike): Sharp, excessive surge — a warning of possible exhaustion or reversal.
Yellow (Elevated Volume): Moderate increase, often during breakout confirmation.
Gray (Low Volume): Reduced participation, signaling potential indecision.
Background highlights and on-chart alerts visually reinforce these signals:
Green background: Healthy, consistent volume environment.
Pink background: Warning of sudden volume spikes.
Orange background: Price-volume divergence, signaling weakening conviction.
Strategic Insights and Warnings
A gradual rise in volume typically validates trend strength, while sharp spikes can serve as early warnings of potential exhaustion. Repeated volume spikes near resistance levels may indicate distribution, whereas spikes near lows often suggest capitulation. Monitoring how volume evolves — not just its magnitude — helps traders stay aligned with smart money flow.
Information Table and Alerts
A real-time dashboard displays key statistics such as current volume, relative multiple of average, consistency level, and pattern type. Built-in alerts notify traders of critical situations, including:
Volume Spike on Up Candle — potential short-term top or euphoria.
Volume Spike on Down Candle — possible bottom or panic-driven selling.
Summary and Practical Use
The Volume Spike | viResearch indicator provides traders with a deeper understanding of volume dynamics, highlighting when market activity supports a move and when it signals exhaustion. By combining volume consistency, relative strength, and pattern recognition, it transforms raw volume data into actionable insights.
Use it to confirm breakout quality, detect unsustainable rallies, or identify accumulation zones before reversals occur. Sustainable trends are built on consistent participation — Volume Spike helps you see when that conviction begins to fade or surge beyond control.
Trading example: Spike volume + Oversold Commodity Index For Loop | viResearch
Note: Historical readings are for analytical purposes only and do not guarantee future performance.
Skrip hanya-undangan
Hanya pengguna yang disetujui oleh penulis yang dapat mengakses skrip ini. Anda perlu meminta dan mendapatkan izin untuk menggunakannya. Izin ini biasanya diberikan setelah pembayaran. Untuk detail selengkapnya, ikuti petunjuk penulis di bawah ini atau hubungi viResearch secara langsung.
TradingView TIDAK menyarankan untuk membayar atau menggunakan skrip kecuali Anda sepenuhnya mempercayai pembuatnya dan memahami cara kerjanya. Anda juga dapat menemukan alternatif yang gratis dan sumber terbuka di skrip komunitas kami.
Instruksi penulis
Pernyataan Penyangkalan
Skrip hanya-undangan
Hanya pengguna yang disetujui oleh penulis yang dapat mengakses skrip ini. Anda perlu meminta dan mendapatkan izin untuk menggunakannya. Izin ini biasanya diberikan setelah pembayaran. Untuk detail selengkapnya, ikuti petunjuk penulis di bawah ini atau hubungi viResearch secara langsung.
TradingView TIDAK menyarankan untuk membayar atau menggunakan skrip kecuali Anda sepenuhnya mempercayai pembuatnya dan memahami cara kerjanya. Anda juga dapat menemukan alternatif yang gratis dan sumber terbuka di skrip komunitas kami.