PROTECTED SOURCE SCRIPT
Diupdate Configurable Yield Curve
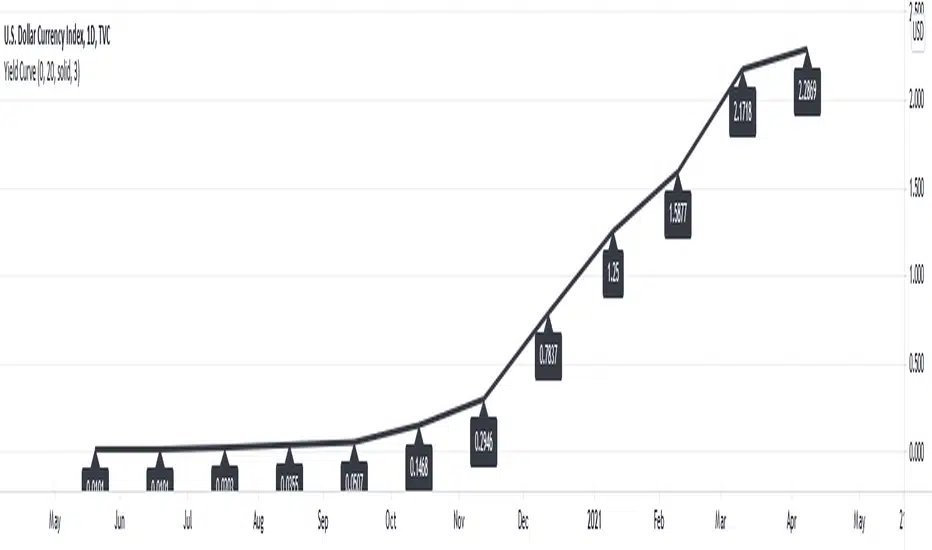
This script draws the US Yield Curve (one month to 30 years). It can be configured to show earlier values using the "Yield values from x bars before" parameter. A value of five and chart time zone "1 day" will show the Yield Curve as it was five days ago. In addition, style settings of the Yield Curve line and the labels can be configured. The drawing engine is also optimized to reduce local and server-side computations.
Catatan Rilis
Added configuration options to include/exclude segments of the yield curve.Skrip terproteksi
Skrip ini diterbitkan sebagai sumber tertutup. Namun, Anda dapat menggunakannya dengan bebas dan tanpa batasan apa pun – pelajari lebih lanjut di sini.
Pernyataan Penyangkalan
Informasi dan publikasi ini tidak dimaksudkan, dan bukan merupakan, saran atau rekomendasi keuangan, investasi, trading, atau jenis lainnya yang diberikan atau didukung oleh TradingView. Baca selengkapnya di Ketentuan Penggunaan.
Skrip terproteksi
Skrip ini diterbitkan sebagai sumber tertutup. Namun, Anda dapat menggunakannya dengan bebas dan tanpa batasan apa pun – pelajari lebih lanjut di sini.
Pernyataan Penyangkalan
Informasi dan publikasi ini tidak dimaksudkan, dan bukan merupakan, saran atau rekomendasi keuangan, investasi, trading, atau jenis lainnya yang diberikan atau didukung oleh TradingView. Baca selengkapnya di Ketentuan Penggunaan.