OPEN-SOURCE SCRIPT
Bollinger Bands (with Width/GaUGE)
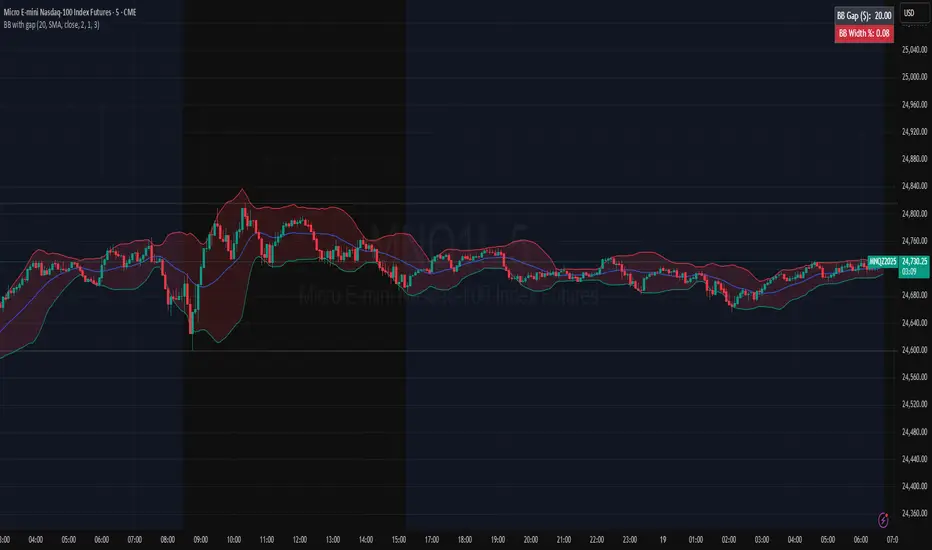
This overlay plots standard Bollinger Bands and makes volatility obvious. The fill between bands is color-coded by band width (tight = red “squeeze”, wide = teal “expansion”, mid = yellow). A compact table (top-right) shows live BB Gap ($) and BB Width (%), and the width also appears in the status line. Thresholds for squeeze/expansion are user-set. Use it to avoid low-volatility chop and time breakouts when width expands.
Skrip open-source
Dengan semangat TradingView yang sesungguhnya, penulis skrip ini telah menjadikannya sumber terbuka, sehingga para trader dapat meninjau dan memverifikasi fungsinya. Hormat untuk penulisnya! Meskipun anda dapat menggunakannya secara gratis, ingatlah bahwa penerbitan ulang kode tersebut tunduk pada Tata Tertib kami.
Pernyataan Penyangkalan
Informasi dan publikasi tidak dimaksudkan untuk menjadi, dan bukan merupakan saran keuangan, investasi, perdagangan, atau rekomendasi lainnya yang diberikan atau didukung oleh TradingView. Baca selengkapnya di Persyaratan Penggunaan.