OPEN-SOURCE SCRIPT
Normalized Market Indicators
Explanation of the Code:
Data Retrieval: The script retrieves the closing prices of the S&P 500 (sp500) and VIX (vix).
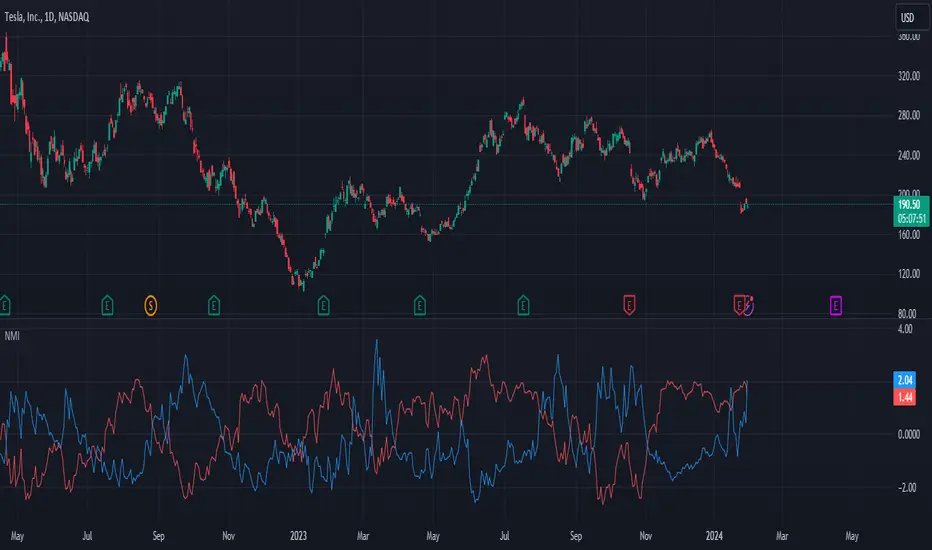
Normalization: The script normalizes these values using a simple z-score normalization (subtracting the 50-period simple moving average and dividing by the 50-period standard deviation). This makes the scales of the two datasets more comparable.
Plotting with Secondary Axis: The normalized values of the S&P 500 and VIX are plotted on the same chart. They will share the same y-axis scale as the main chart (e.g. Netflix, GOLD, Forex).
Points to Note:
Normalization Method: The method of normalization (z-score in this case) is a choice and can be adjusted based on your needs. The idea is to bring the data to a comparable scale.
Timeframe and Symbol Codes: Ensure the timeframe and symbol codes are appropriate for your data source and trading strategy.
Overlaying on Price Chart: Since these values are normalized and plotted on a seperate chart, they won't directly correspond to the price levels of the main chart (e.g. Netflix, GOLD, Forex).
Data Retrieval: The script retrieves the closing prices of the S&P 500 (sp500) and VIX (vix).
Normalization: The script normalizes these values using a simple z-score normalization (subtracting the 50-period simple moving average and dividing by the 50-period standard deviation). This makes the scales of the two datasets more comparable.
Plotting with Secondary Axis: The normalized values of the S&P 500 and VIX are plotted on the same chart. They will share the same y-axis scale as the main chart (e.g. Netflix, GOLD, Forex).
Points to Note:
Normalization Method: The method of normalization (z-score in this case) is a choice and can be adjusted based on your needs. The idea is to bring the data to a comparable scale.
Timeframe and Symbol Codes: Ensure the timeframe and symbol codes are appropriate for your data source and trading strategy.
Overlaying on Price Chart: Since these values are normalized and plotted on a seperate chart, they won't directly correspond to the price levels of the main chart (e.g. Netflix, GOLD, Forex).
Skrip open-source
Dengan semangat TradingView yang sesungguhnya, pembuat skrip ini telah menjadikannya sebagai sumber terbuka, sehingga para trader dapat meninjau dan memverifikasi fungsinya. Salut untuk penulisnya! Meskipun Anda dapat menggunakannya secara gratis, perlu diingat bahwa penerbitan ulang kode ini tunduk pada Tata Tertib kami.
Pernyataan Penyangkalan
Informasi dan publikasi ini tidak dimaksudkan, dan bukan merupakan, saran atau rekomendasi keuangan, investasi, trading, atau jenis lainnya yang diberikan atau didukung oleh TradingView. Baca selengkapnya di Ketentuan Penggunaan.