PROTECTED SOURCE SCRIPT
Trend Momentum Algorithm
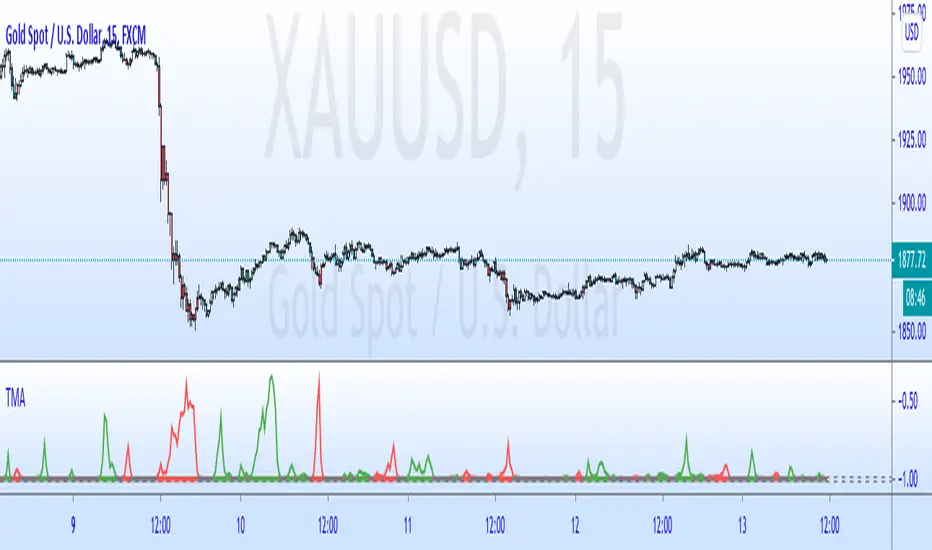
This algorithm comes from 2 inverse fisher transforms of a williams %R. After experimenting. I found that this is useful to understand the momentum of chart.
If green, only look for buy opportunities, if red, look for sells. If gray, look for whatever the previous colour was.
Can be useful with divergence. I'd look at a lower timeframe for confirmation (if divergence suggests turning bearish look for red on a lower timeframe. Be aware of the momentum on the timeframe above)
I put a tolerance filer on to help remove any smaller spikes. The larger the tolerance the less inaccuracies you will have but see the start of an new trend later.
This is a fun tool. Enjoy
Skrip terproteksi
Skrip ini diterbitkan sebagai sumber tertutup. Namun, Anda dapat menggunakannya dengan bebas dan tanpa batasan apa pun – pelajari lebih lanjut di sini.
Pernyataan Penyangkalan
Informasi dan publikasi ini tidak dimaksudkan, dan bukan merupakan, saran atau rekomendasi keuangan, investasi, trading, atau jenis lainnya yang diberikan atau didukung oleh TradingView. Baca selengkapnya di Ketentuan Penggunaan.