OPEN-SOURCE SCRIPT
BDC - Bitcoin (BTC) Dominance Change [Logue]
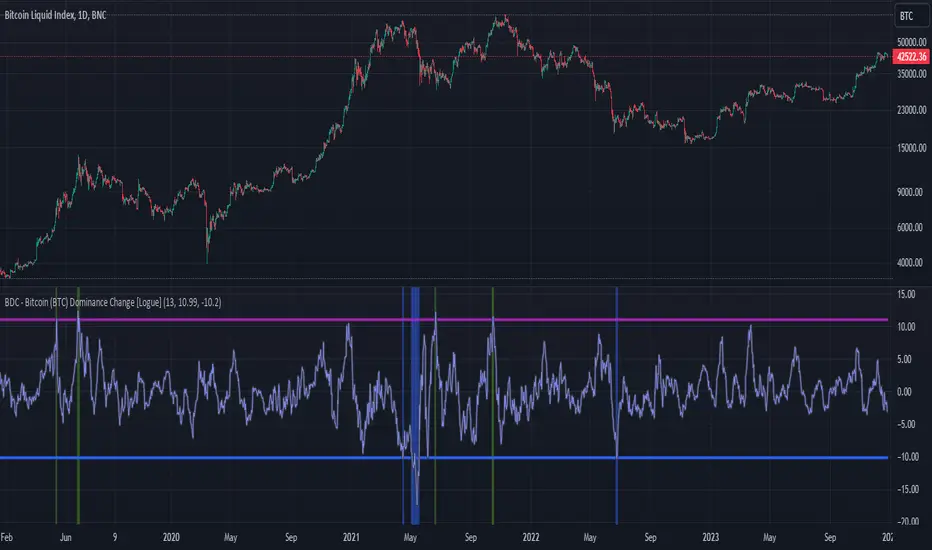
Bitcoin Dominance Change. Interesting things tend to happen when the Bitcoin dominance increases or decreases rapidly. Perhaps because there is overexuberance in the market in either BTC or the alts. In back testing, I found a rapid 13-day change in dominance indicates interesting switches in the BTC trends. Prior to 2019, the indicator doesn't work as well to signal trend shifts (i.e., local tops and bottoms) likely based on very few coins making up the crypto market.
The BTC dominance change is calculated as a percentage change of the daily dominance. You are able to change the upper bound, lower bound, and the period (daily) of the indicator to your own preferences. The indicator going above the upper bound or below the lower bound will trigger a different background color.
Use this indicator at your own risk. I make no claims as to its accuracy in forecasting future trend changes of Bitcoin.
Skrip open-source
Dengan semangat TradingView yang sesungguhnya, pembuat skrip ini telah menjadikannya sebagai sumber terbuka, sehingga para trader dapat meninjau dan memverifikasi fungsinya. Salut untuk penulisnya! Meskipun Anda dapat menggunakannya secara gratis, perlu diingat bahwa penerbitan ulang kode ini tunduk pada Tata Tertib kami.
Pernyataan Penyangkalan
Informasi dan publikasi ini tidak dimaksudkan, dan bukan merupakan, saran atau rekomendasi keuangan, investasi, trading, atau jenis lainnya yang diberikan atau didukung oleh TradingView. Baca selengkapnya di Ketentuan Penggunaan.