OPEN-SOURCE SCRIPT
Candle Shape
Candle Shape
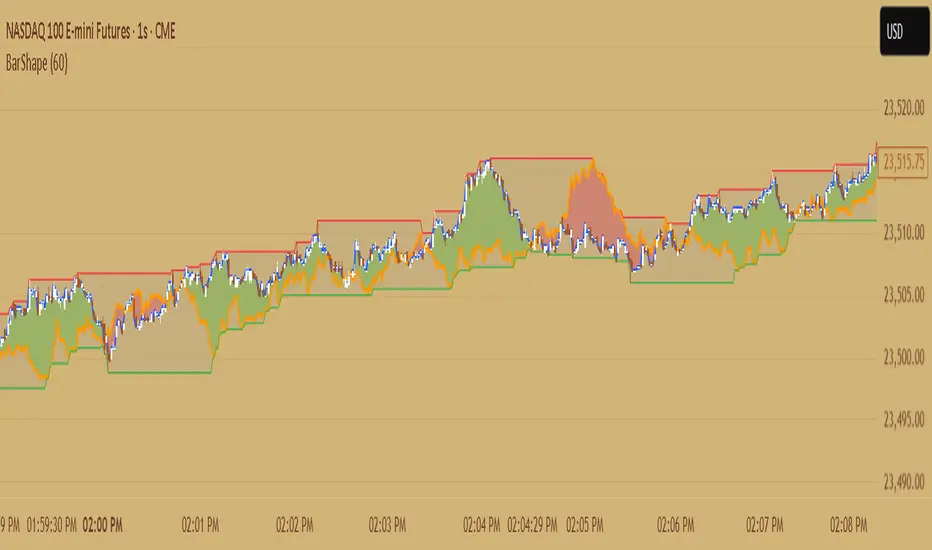
This indicator visualizes rolling candles that aggregate price action over a chosen lookback period, allowing you to see how OHLC dynamics evolve in real time.
Instead of waiting for a higher timeframe (HTF) bar to close, you can track its development directly from a lower timeframe chart.
For example, view how a 1-hour candle is forming on a 1-minute chart — complete with rolling open, high, low, and close levels, as well as colored body and wick areas.
---
🔹 How it works
- Lookback Period (n) → sets the bucket size, defining how many bars are merged into a “meta-candle.”
- The script continuously updates the meta-open, meta-high, meta-low, and meta-close.
- Body and wick areas are filled with color, making bullish/bearish transitions easy to follow.
---
🔹 Use cases
- Monitor the intra-development of higher timeframe candles.
- Analyze rolling OHLC structures to understand how price dynamics shift across different aggregation windows.
- Explore unique perspectives for strategy confirmation, breakout anticipation, and market structure analysis.
---
✨ Candle Shape bridges the gap between timeframes and uncovers new layers of price interaction.
Skrip open-source
Dengan semangat TradingView yang sesungguhnya, pembuat skrip ini telah menjadikannya sebagai sumber terbuka, sehingga para trader dapat meninjau dan memverifikasi fungsinya. Salut untuk penulisnya! Meskipun Anda dapat menggunakannya secara gratis, perlu diingat bahwa penerbitan ulang kode ini tunduk pada Tata Tertib kami.
Pernyataan Penyangkalan
Informasi dan publikasi ini tidak dimaksudkan, dan bukan merupakan, saran atau rekomendasi keuangan, investasi, trading, atau jenis lainnya yang diberikan atau didukung oleh TradingView. Baca selengkapnya di Ketentuan Penggunaan.