PROTECTED SOURCE SCRIPT
Diupdate Sentival | QuantEdgeB
Introducing Sentival by QuantEdgeB.
An Adaptive Multi-Factor Indicator for Market Valuation & Trend Strength
____
Overview
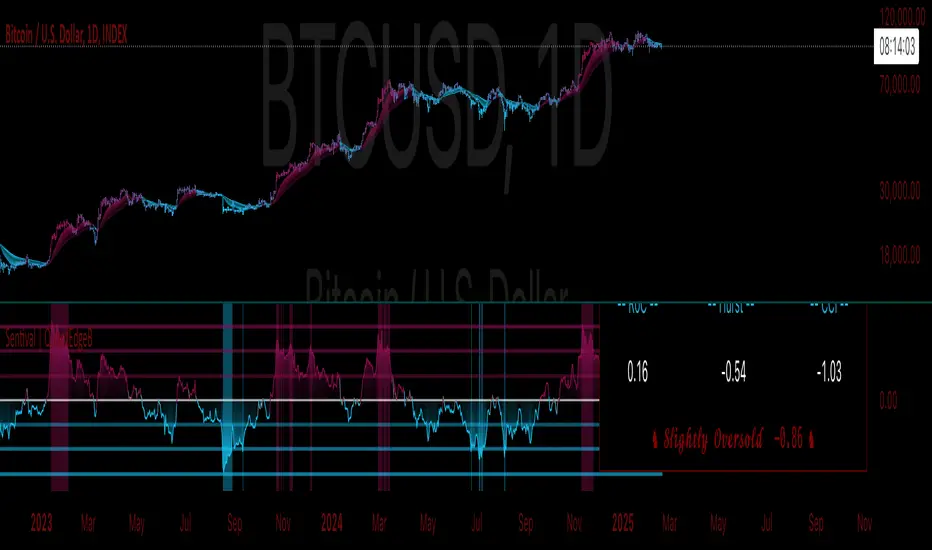
The Sentival Valuation System is a medium-term, multi-factor valuation tool designed to assess market conditions using a combination of momentum, mean reversion, and risk-adjusted metrics. It provides traders and investors with a dynamic score reflecting market valuation, ranging from strongly oversold to strongly overbought conditions.
This system leverages a diverse range of technical indicators, including momentum oscillators, volatility measures, risk ratios, and mean-reversion metrics, providing a holistic view of market conditions.
____
1. Key Features
🛠 Multi-Factor Valuation Model
Sentival aggregates nine different indicators, normalizing and rescaling them into a standardized z-score-based valuation system. The final output represents an average of the selected indicators, allowing for flexible customization based on the user’s preference.
📊 Customizable Indicator Selection
Users can enable or disable any of the nine valuation factors, ensuring the system adapts to different market environments, trading styles, and assets.
🔄 Multi-Timeframe Adaptability
Sentival can be used across different time horizons, making it suitable for short-term mean reversion, medium-term traders, or long-term valuation analysis by simply adjusting the timeframe and indicator settings. This flexibility allows traders to adapt Sentival to various market conditions and trading objectives.
🎨 Intuitive Dashboard & Color Coding
- Dynamic Heatmap & Dashboard: Displays valuation strength across multiple factors.
- Gradient-Based Overbought/Oversold Signals: Clear color-coded signals for easy interpretation.
- Background Highlighting: Optional oversold/overbought background zones.
🏆 Statistical & Risk-Based Insights
- Standardized Rescaling & Z-Score Analysis to prevent bias from individual indicators.
- Risk-Adjusted Metrics such as Sharpe, Sortino, and Omega Ratios help assess the overall market risk appetite.
- Trend Following Mode (TF Display): Users can enable the "Trend Following" option to display the trend direction, helping to align valuation signals with the broader market trend.
____
2. How It Works
1️⃣ Normalization & Rescaling: Each selected indicator is transformed into a standardized scale to ensure fair weighting and prevent distortions from extreme values.
2️⃣ Multi-Indicator Aggregation: The system averages multiple valuation signals into a single z-score, providing a clear overbought/oversold reading rather than relying on a single metric.
3️⃣ Dynamic Trend Filtering: Users can enable Trend Following Mode (TF Display) to overlay directional trend confirmation, helping align valuation signals with momentum.
____
4. Sentival Valuation Score & Interpretation
🔹 Sentival Score Ranges
- 📉 Strongly Oversold (-2 and below) → Market is extremely undervalued; potential reversal.
- 📉 Moderately Oversold (-1.5 to -2) → Discounted market conditions, buying interest may emerge.
- 📉 Slightly Oversold (-0.5 to -1.5) → Possible accumulation phase.
- ⚖ Fair Value (-0.5 to +0.5) → Market trading at equilibrium.
- 📈 Slightly Overbought (+0.5 to +1.5) → Initial signs of market strength.
- 📈 Moderately Overbought (+1.5 to +2) → Market heating up, caution warranted, selling interest may emerge.
- 📈 Strongly Overbought (+2 and above) → Extreme valuation, increased risk of correction.
This classification helps traders gauge overall market sentiment and make better allocation decisions.
Note: Past valuations and buy/sell signals generated by Sentival do not guarantee future performance. Market conditions can change, and proper risk management should always be applied.
____
5. Use Cases & Applications
🔹 📊 Market Rotation & Asset Allocation
- Used as a valuation model to determine if a market or asset is undervalued or overvalued.
- Rotational strategies can benefit from the valuation score by switching exposure between assets.
🔹 📈 Medium-Term Trend Identification
- Detects overbought and oversold conditions while filtering out short-term noise.
- Can be combined with other trend-following indicators for confluence-based strategies.
🔹 🔄 Mean Reversion & Momentum Trading
- Provides statistical validation for momentum breakouts or mean reversion signals.
- Useful for long-short trading strategies, determining optimal entry & exit points.
____
Conclusion
Sentival is a powerful universal valuation system for traders and investors seeking a data-driven, multi-factor approach to market valuation. With its combination of momentum, trend, risk-adjusted, and mean-reversion indicators, it provides a robust, adaptable, and statistically sound framework for making informed market decisions.
🔹 Who Should Use Sentival?
✅ Swing Traders & Medium-Term Investors looking for structured valuation metrics.
✅ Quantitative & Systematic Traders incorporating multi-factor models.
✅ Portfolio Managers optimizing exposure to different market regimes.
🔹 Disclaimer: Past performance is not indicative of future results. No trading strategy can guarantee success in financial markets.
🔹 Strategic Advice: Always backtest, optimize, and align parameters with your trading objectives and risk tolerance before live trading.
An Adaptive Multi-Factor Indicator for Market Valuation & Trend Strength
____
Overview
The Sentival Valuation System is a medium-term, multi-factor valuation tool designed to assess market conditions using a combination of momentum, mean reversion, and risk-adjusted metrics. It provides traders and investors with a dynamic score reflecting market valuation, ranging from strongly oversold to strongly overbought conditions.
This system leverages a diverse range of technical indicators, including momentum oscillators, volatility measures, risk ratios, and mean-reversion metrics, providing a holistic view of market conditions.
____
1. Key Features
🛠 Multi-Factor Valuation Model
Sentival aggregates nine different indicators, normalizing and rescaling them into a standardized z-score-based valuation system. The final output represents an average of the selected indicators, allowing for flexible customization based on the user’s preference.
📊 Customizable Indicator Selection
Users can enable or disable any of the nine valuation factors, ensuring the system adapts to different market environments, trading styles, and assets.
🔄 Multi-Timeframe Adaptability
Sentival can be used across different time horizons, making it suitable for short-term mean reversion, medium-term traders, or long-term valuation analysis by simply adjusting the timeframe and indicator settings. This flexibility allows traders to adapt Sentival to various market conditions and trading objectives.
🎨 Intuitive Dashboard & Color Coding
- Dynamic Heatmap & Dashboard: Displays valuation strength across multiple factors.
- Gradient-Based Overbought/Oversold Signals: Clear color-coded signals for easy interpretation.
- Background Highlighting: Optional oversold/overbought background zones.
🏆 Statistical & Risk-Based Insights
- Standardized Rescaling & Z-Score Analysis to prevent bias from individual indicators.
- Risk-Adjusted Metrics such as Sharpe, Sortino, and Omega Ratios help assess the overall market risk appetite.
- Trend Following Mode (TF Display): Users can enable the "Trend Following" option to display the trend direction, helping to align valuation signals with the broader market trend.
____
2. How It Works
1️⃣ Normalization & Rescaling: Each selected indicator is transformed into a standardized scale to ensure fair weighting and prevent distortions from extreme values.
2️⃣ Multi-Indicator Aggregation: The system averages multiple valuation signals into a single z-score, providing a clear overbought/oversold reading rather than relying on a single metric.
3️⃣ Dynamic Trend Filtering: Users can enable Trend Following Mode (TF Display) to overlay directional trend confirmation, helping align valuation signals with momentum.
____
4. Sentival Valuation Score & Interpretation
🔹 Sentival Score Ranges
- 📉 Strongly Oversold (-2 and below) → Market is extremely undervalued; potential reversal.
- 📉 Moderately Oversold (-1.5 to -2) → Discounted market conditions, buying interest may emerge.
- 📉 Slightly Oversold (-0.5 to -1.5) → Possible accumulation phase.
- ⚖ Fair Value (-0.5 to +0.5) → Market trading at equilibrium.
- 📈 Slightly Overbought (+0.5 to +1.5) → Initial signs of market strength.
- 📈 Moderately Overbought (+1.5 to +2) → Market heating up, caution warranted, selling interest may emerge.
- 📈 Strongly Overbought (+2 and above) → Extreme valuation, increased risk of correction.
This classification helps traders gauge overall market sentiment and make better allocation decisions.
Note: Past valuations and buy/sell signals generated by Sentival do not guarantee future performance. Market conditions can change, and proper risk management should always be applied.
____
5. Use Cases & Applications
🔹 📊 Market Rotation & Asset Allocation
- Used as a valuation model to determine if a market or asset is undervalued or overvalued.
- Rotational strategies can benefit from the valuation score by switching exposure between assets.
🔹 📈 Medium-Term Trend Identification
- Detects overbought and oversold conditions while filtering out short-term noise.
- Can be combined with other trend-following indicators for confluence-based strategies.
🔹 🔄 Mean Reversion & Momentum Trading
- Provides statistical validation for momentum breakouts or mean reversion signals.
- Useful for long-short trading strategies, determining optimal entry & exit points.
____
Conclusion
Sentival is a powerful universal valuation system for traders and investors seeking a data-driven, multi-factor approach to market valuation. With its combination of momentum, trend, risk-adjusted, and mean-reversion indicators, it provides a robust, adaptable, and statistically sound framework for making informed market decisions.
🔹 Who Should Use Sentival?
✅ Swing Traders & Medium-Term Investors looking for structured valuation metrics.
✅ Quantitative & Systematic Traders incorporating multi-factor models.
✅ Portfolio Managers optimizing exposure to different market regimes.
🔹 Disclaimer: Past performance is not indicative of future results. No trading strategy can guarantee success in financial markets.
🔹 Strategic Advice: Always backtest, optimize, and align parameters with your trading objectives and risk tolerance before live trading.
Catatan Rilis
Spelling mistake fixedCatatan Rilis
Deep Dive: How Sentival Works & Why It MattersSentival is a multi-factor trend and momentum analysis system, designed to track market cycle shifts using a combination of volatility, momentum, risk assessment, and valuation mechanisms. Instead of focusing on one dimension of the market, Sentival integrates multiple methodologies to cross-validate signals and reduce noise. Each indicator in Sentival plays a specific role, ensuring confirmation across different market conditions.
How Each Component Works Together
1️⃣ Chande Momentum Oscillator (CMO)
• A momentum-based measure that determines whether price action is dominated by upward or downward forces.
• Works well in combination with volatility measures to confirm whether a move is sustainable.
2️⃣ Disparity Index
• Measures the distance between price and its moving average, acting as an overextension filter.
• Ensures that trend-following signals are not driven by short-term spikes but sustained trends.
3️⃣ Bollinger Bands % (BB%)
• A volatility measure that indicates how far price is from the statistical mean.
• Helps identify trend exhaustion points where price moves become unstable.
4️⃣ Relative Strength Index (RSI)
• A trend confirmation layer, ensuring that momentum strength aligns with price movement.
• Adds an additional check to prevent false breakouts.
5️⃣ Rate of Change (RoC)
• Captures the speed of price movement, ensuring that the market has enough momentum for trend continuation.
• Works well with risk indicators to filter weaker moves.
6️⃣ Price Z-Score
• A statistical tool to measure how far price is from its long-term equilibrium.
• Helps prevent entering overstretched trends too late.
7️⃣ Risk Ratios (Sharpe, Sortino, Omega)
• This is the risk-adjusted performance component, ensuring that trends have a healthy risk-reward balance.
• Helps determine when a trend has structurally strong backing rather than speculative movement.
8️⃣ Hurst Cycle Analysis
• Measures the persistence of trends by analyzing price fractals.
• Ensures that the market regime is either trending or mean-reverting, improving trade confidence.
9️⃣ Commodity Channel Index (CCI)
• Helps identify strong trend conditions, adding another layer of momentum confirmation.
• Works well with other oscillators to prevent misreading counter-trends.
🔗 Why These Components Work Well Together
• Momentum + Volatility + Risk → Instead of relying on a single category, Sentival merges multiple dimensions of market behavior into a cohesive signal.
• Filters Out False Signals → Combining momentum oscillators, volatility measures, and risk-adjusted metrics ensures high-confidence entries.
• Adaptability Across Market Regimes → Whether the market is trending, consolidating, or volatile, the system adjusts dynamically.
• Cross-Validation for Trend Strength → If multiple components align, it increases certainty that a trend is real and sustainable.
🚀 Final Thoughts
Sentival it’s a hybrid trend validation model that integrates momentum, volatility, and risk into a single, structured signal.
👉 Ideal for traders looking to identify strong, sustainable trends while filtering out weaker, unreliable signals in various market conditions.
Skrip terproteksi
Skrip ini diterbitkan sebagai sumber tertutup. Namun, Anda dapat menggunakannya dengan bebas dan tanpa batasan apa pun – pelajari lebih lanjut di sini.
🔹 Get access to our premium tools:
whop.com/quantedgeb/ 💎
🔹 Unlock our free toolbox:
tradinglibrary.carrd.co/ 🛠️
Disclaimer: All resources and indicators provided are for educational purposes only
whop.com/quantedgeb/ 💎
🔹 Unlock our free toolbox:
tradinglibrary.carrd.co/ 🛠️
Disclaimer: All resources and indicators provided are for educational purposes only
Pernyataan Penyangkalan
Informasi dan publikasi ini tidak dimaksudkan, dan bukan merupakan, saran atau rekomendasi keuangan, investasi, trading, atau jenis lainnya yang diberikan atau didukung oleh TradingView. Baca selengkapnya di Ketentuan Penggunaan.