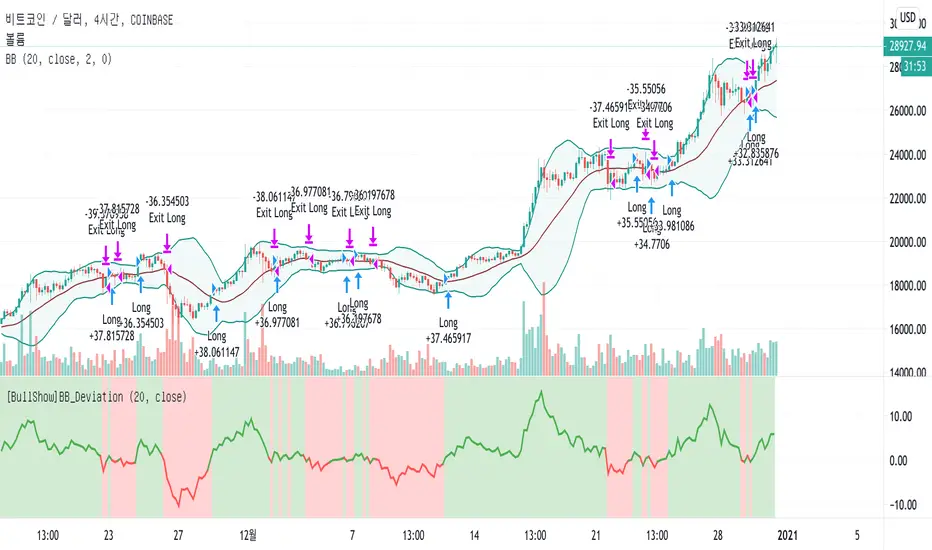
[BullShow]BollingerBands_Deviation Strategy

Are you enjoying this crazy bull market?
I want to Introduce very classic and simple but powerful strategy.
My strategy is using Bollinger Bands. Yes! It's the indicator that everyone knows and uses.
First of all, let's look at how Wikipedia defines the Bollinger Bands.
Bollinger Bands - Wikipedia
------------
Introduce
Bollinger Bands (/ˈbɒlɪnjdʒər bændz/) are a type of statistical chart characterizing the prices and volatility over time of a financial instrument or commodity, using a formulaic method propounded by John Bollinger in the 1980s.
Purpose
The purpose of Bollinger Bands is to provide a relative definition of high and low prices of a market. By definition, prices are high at the upper band and low at the lower band. This definition can aid in rigorous pattern recognition and is useful in comparing price action to the action of indicators to arrive at systematic trading decisions.
Interpretation
The use of Bollinger Bands varies widely among traders. Some traders buy when price touches the lower Bollinger Band and exit when price touches the moving average in the center of the bands. Other traders buy when price breaks above the upper Bollinger Band or sell when price falls below the lower Bollinger Band. Moreover, the use of Bollinger Bands is not confined to stock traders; options traders, most notably implied volatility traders, often sell options when Bollinger Bands are historically far apart or buy options when the Bollinger Bands are historically close together, in both instances, expecting volatility to revert towards the average historical volatility level for the stock.
------------
However, the use of the Bollinger Bands described on the website is only very abstract without precise guidelines.
So, by calculating the deviation of the 20-days moving average line, the center line of the Bollinger Bands, I chose a strategy to buy when the deviation starts to widen and sell when the separation starts to narrow again.
As a result, I found a strategy that would give you a decent return.
Due to the nature of the strategy, trades in the box zone are frequent, so the win rate is small, but when the price trend is confirmed, you can get a big profit.
Therefore, you can expect good returns from pair with a clear trend rather than pair that trade frequently in the box zone.
If you are interested in my strategy, Use the link below to obtain access to this indicator or PM me to obtain access
Thank you for your supporting.
안녕하세요 여러분.
이 미친 강세장을 즐기고 있습니까?
매우 고전적이고 단순하지만 강력한 전략을 소개하고 싶습니다.
제 전략은 볼린저 밴드를 사용하는 것입니다. 예! 모두가 알고 사용하는 그 지표입니다.
그러나 웹에서 설명하는 사용 방법은 정확한 지침없이 매우 추상적 일 뿐입니다.
따라서 저는 볼린저 밴드의 중심선 인 20 일 이동 평균선의 편차를 계산하여 편차가 확대되기 시작하면 매수하고 편차가 다시 좁아지기 시작하면 매도하는 전략을 선택했습니다.
결과적으로, 나는 당신에게 적절한 수익을 줄 전략을 찾았습니다.
전략의 특성상 박스 존에서의 거래가 빈번해 승률은 적지 만 가격 추세가 확인되면 큰 수익을 얻을 수 있습니다.
따라서 박스 존에서 자주 거래되는 패어보다는 명확한 추세의 패어에서 좋은 수익을 기대할 수 있습니다.
전략에 관심이 있으시거나 사용을 원하신다면 아래를 참고 해 주시거나 PM을 보내주세요.
감사합니다.
Back Testing
*initial_capital: $10000
*default_qty_value: 100%
*commission_value: 0.1%
*Period: 2017.01.01~
Profit
BTCUSD: 3109%
ETHUSD: 11160%
YFIUSDT: 823.88%
ZILUSDT: 570.84%
BNBUSDT: 937.18%
LINKUSDT: 471.41%
*Due to the nature of the strategy, a pair with a strong trend yields better results.
*전략 특성상 추세가 강한 패어에서 더 좋은 결과를 도출합니다.
*Optimized for a 4 hour time frame and a 12 hour time frame.
*4 시간 시간 프레임과 12 시간 시간 프레임에 최적화되었습니다.
Skrip hanya-undangan
Hanya pengguna yang disetujui oleh penulis yang dapat mengakses skrip ini. Anda harus meminta dan mendapatkan izin untuk menggunakannya. Izin ini biasanya diberikan setelah pembayaran. Untuk detail lebih lanjut, ikuti petunjuk penulis di bawah ini atau hubungi BullShow secara langsung.
TradingView TIDAK menyarankan untuk membayar atau menggunakan skrip kecuali anda benar-benar percaya kepada pembuatnya dan memahami cara kerjanya. Anda juga dapat menemukan alternatif sumber terbuka yang gratis di skrip komunitas kami.
Instruksi penulis
Pernyataan Penyangkalan
Skrip hanya-undangan
Hanya pengguna yang disetujui oleh penulis yang dapat mengakses skrip ini. Anda harus meminta dan mendapatkan izin untuk menggunakannya. Izin ini biasanya diberikan setelah pembayaran. Untuk detail lebih lanjut, ikuti petunjuk penulis di bawah ini atau hubungi BullShow secara langsung.
TradingView TIDAK menyarankan untuk membayar atau menggunakan skrip kecuali anda benar-benar percaya kepada pembuatnya dan memahami cara kerjanya. Anda juga dapat menemukan alternatif sumber terbuka yang gratis di skrip komunitas kami.