OPEN-SOURCE SCRIPT
ka66: Externally-Sourced MACD
This indicator generalises the idea of MACD to take any arbitrary series available on the chart, using input.source values.
To provide an overview of the MACD indicator:
With this indicator, you can analyse momentum between any 2 series (not just EMAs), they could be raw close prices, other moving averages on the chart including specialised ones, that most MACD implementations won't provide a facility for, for example Kaufman Moving Average.
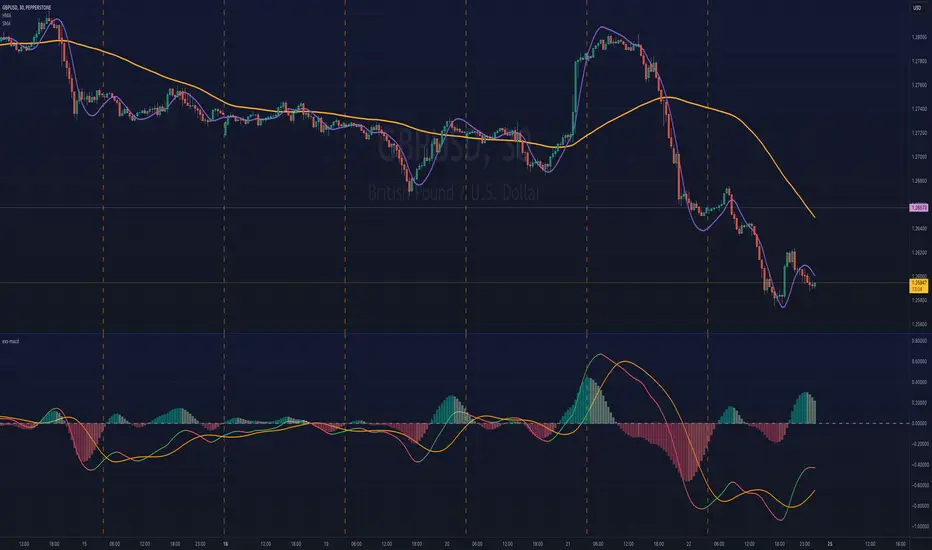
The chart shows this indicator sourcing 2 inputs from the chart:
It then calculates the MACD (Series1 - Series2), and a Signal line from the resulting MACD.
A signal series is still calculated manually by the indicator, and thus will be restricted to the provided moving average options (this indicator provides a few like EMA, SMA, Hull, and so on).
Uses of this indicator are essentially what you will use a MACD for:
To provide an overview of the MACD indicator:
- You have two EMAs, one with a faster period, usually 12, another with a slower period, usually 26.
- You calculate a MACD line, by doing (fastEMA - slowEMA)
- You then calculate a Signal Line by taking a moving average of the MACD line over some period.
With this indicator, you can analyse momentum between any 2 series (not just EMAs), they could be raw close prices, other moving averages on the chart including specialised ones, that most MACD implementations won't provide a facility for, for example Kaufman Moving Average.
The chart shows this indicator sourcing 2 inputs from the chart:
- A Hull Moving Average as the fast series
- And a Simple Moving Average as the slow series
It then calculates the MACD (Series1 - Series2), and a Signal line from the resulting MACD.
A signal series is still calculated manually by the indicator, and thus will be restricted to the provided moving average options (this indicator provides a few like EMA, SMA, Hull, and so on).
Uses of this indicator are essentially what you will use a MACD for:
- Evaluate momentum of a strength.
- Crossover Signals: MACD vs. Signal, MACD vs. Zero Line, MACD Histogram gradation.
- Evaluate overbought/oversold conditions.
- As a low-resolution view to confirm price action.
- Divergences
Skrip open-source
Dengan semangat TradingView yang sesungguhnya, pembuat skrip ini telah menjadikannya sebagai sumber terbuka, sehingga para trader dapat meninjau dan memverifikasi fungsinya. Salut untuk penulisnya! Meskipun Anda dapat menggunakannya secara gratis, perlu diingat bahwa penerbitan ulang kode ini tunduk pada Tata Tertib kami.
Pernyataan Penyangkalan
Informasi dan publikasi ini tidak dimaksudkan, dan bukan merupakan, saran atau rekomendasi keuangan, investasi, trading, atau jenis lainnya yang diberikan atau didukung oleh TradingView. Baca selengkapnya di Ketentuan Penggunaan.