PROTECTED SOURCE SCRIPT
Diupdate RoadMap Panel
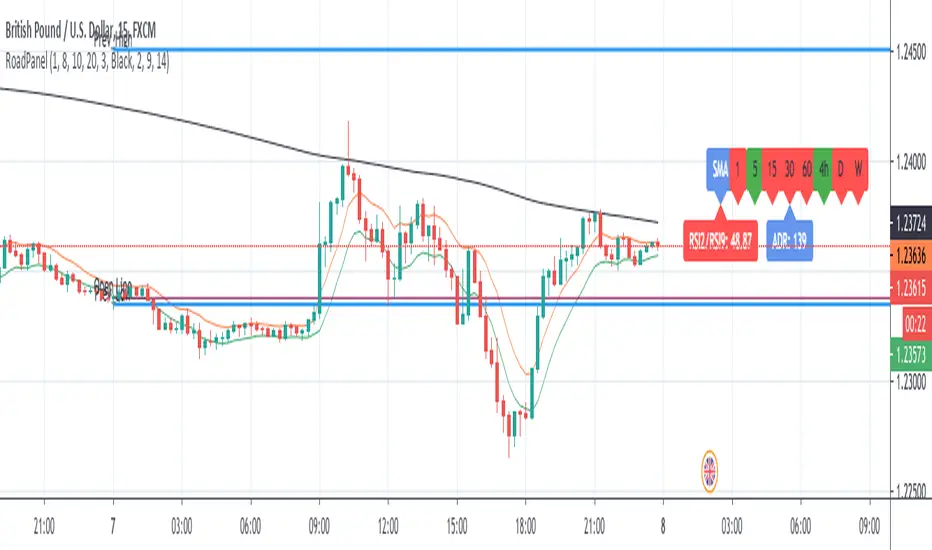
This study is usefull for who follows the rules of "Laura's RoadMap" trading strategy.
If someone doesn't know what I'm talking about, google it because I cannot post link here.
It could be used for scaliping too.
Basically, the rules are:
- Open only in direction of Multitimeframe SMA200
- EMA high/low channel shall be above(buy) or below (Sell) SMA200
- RSI2/RSI9 shall be above(buy) or below (sell) 50
- Look at ADR, last day high/low, daily open for possible supports/resistance.
Next improvement (only to whom is interested to this script and follows me): ADR, last day high/low, daily open to be added to this study.
Next improvement (only to whom is interested to this script and follows me): Alerts to be added.
Please use comment section for any feedback.
********************************** IMPORTANT********************************************************************
I have developed an expert advisor for metatrader4 (MT4) with good results in 2019-April 2020
*********************************************************************************************************************
This study is free to use but code is private. If you like or have question please use comment section.
Check also my other scripts at tradingview.com/u/03.freeman/
Thanks for your feedbaks.
Catatan Rilis
Added:1- ADR info label
2- ADR high-low lines
3- Previous day high-low lines
4- Daily open line
NOTE: display needs improvements, but actually it displays well on 1 min to 30 min timeframes.
Skrip terproteksi
Skrip ini diterbitkan sebagai sumber tertutup. Namun, Anda dapat menggunakannya dengan bebas dan tanpa batasan apa pun – pelajari lebih lanjut di sini.
Pernyataan Penyangkalan
Informasi dan publikasi ini tidak dimaksudkan, dan bukan merupakan, saran atau rekomendasi keuangan, investasi, trading, atau jenis lainnya yang diberikan atau didukung oleh TradingView. Baca selengkapnya di Ketentuan Penggunaan.