SKYNET buy/sell 2.0
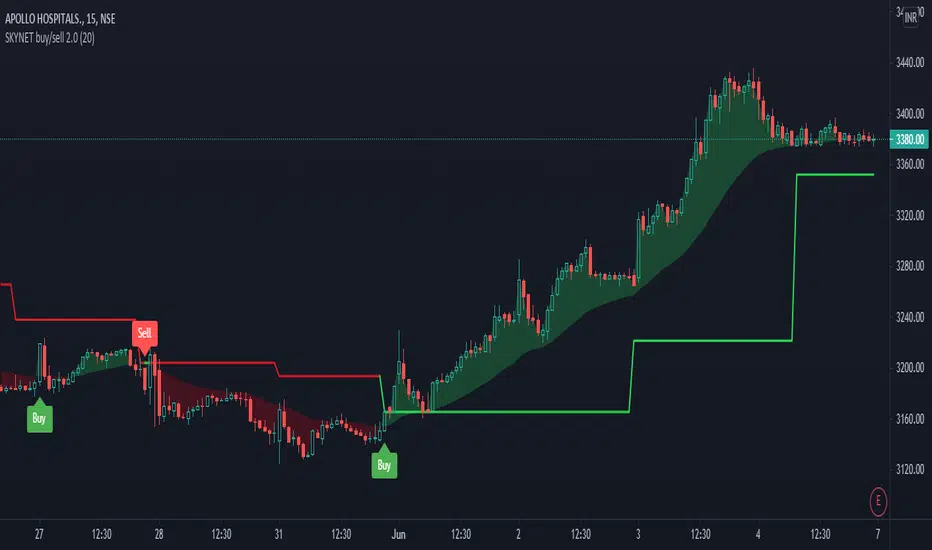
**Anchor line : This anchor line is calculated based on certain parameters.
The anchor line is calculated in such a way that the stock/instrument moves around this anchor line.
The calculation of the anchor line uses a look back period which is set to 9 by default. The user can go to the indicator settings and change it to suit their trading style.
Note:
1) As the look back period increases, the number of signals generated on the chart decreases.
2) This indicator will only work on charts/stocks/instruments which are actually traded in the market i.e actual contracts of the stock/instrument is traded in the market. Hence, it will not work on indexes.
BUY signal: When the stock/instrument deviates to the upside of the anchor line by a specific margin, the Buy signal is generated.
SELL signal: When the stock/instrument deviates to the downside of the anchor line by a specific margin, the Sell signal is generated.
Disclaimer: This indicator is not 100% accurate and false signals are generated from time to time. Trading in the markets involves huge risks and one should always do his/her own research before making any trading decisions. This indicator is only designed to help you make a trading decision.
++ A time constraint has been added. The indicator script now runs between
9:30 to 1500.
The VISUAL TREND is established by using a couple of exponential moving averages with customized parameters and settings.
A buy signal is more likely to work if the VISUAL TREND is bullish.
A sell signal is more likely to work if the VISUAL TREND is bearish.
++ Time constraint has been removed to increase the efficiency of the indicator on cryptocurrency charts.
https://www.tradingview.com/x/l6SzG0sB/
Skrip hanya-undangan
Hanya pengguna yang disetujui oleh penulis yang dapat mengakses skrip ini. Anda perlu meminta dan mendapatkan izin untuk menggunakannya. Izin ini biasanya diberikan setelah pembayaran. Untuk detail selengkapnya, ikuti petunjuk penulis di bawah ini atau hubungi skynet970 secara langsung.
TradingView TIDAK menyarankan untuk membayar atau menggunakan skrip kecuali Anda sepenuhnya mempercayai pembuatnya dan memahami cara kerjanya. Anda juga dapat menemukan alternatif yang gratis dan sumber terbuka di skrip komunitas kami.
Instruksi penulis
Pernyataan Penyangkalan
Skrip hanya-undangan
Hanya pengguna yang disetujui oleh penulis yang dapat mengakses skrip ini. Anda perlu meminta dan mendapatkan izin untuk menggunakannya. Izin ini biasanya diberikan setelah pembayaran. Untuk detail selengkapnya, ikuti petunjuk penulis di bawah ini atau hubungi skynet970 secara langsung.
TradingView TIDAK menyarankan untuk membayar atau menggunakan skrip kecuali Anda sepenuhnya mempercayai pembuatnya dan memahami cara kerjanya. Anda juga dapat menemukan alternatif yang gratis dan sumber terbuka di skrip komunitas kami.