OPEN-SOURCE SCRIPT
ORDINARY LEAST SQUARES Slope by @XeL_Arjona
ORDINARY LEAST SQUARES Slope by xel_arjona
Ver. 1 by Ricardo M Arjona xel_arjona
DISCLAIMER:
The Following indicator/code IS NOT intended to be a formal investment advice or recommendation by the author, nor should be construed as such. Users will be fully responsible by their use regarding their own trading vehicles/assets.
The embedded code and ideas within this work are FREELY AND PUBLICLY available on the Web for NON LUCRATIVE ACTIVITIES and must remain as is.
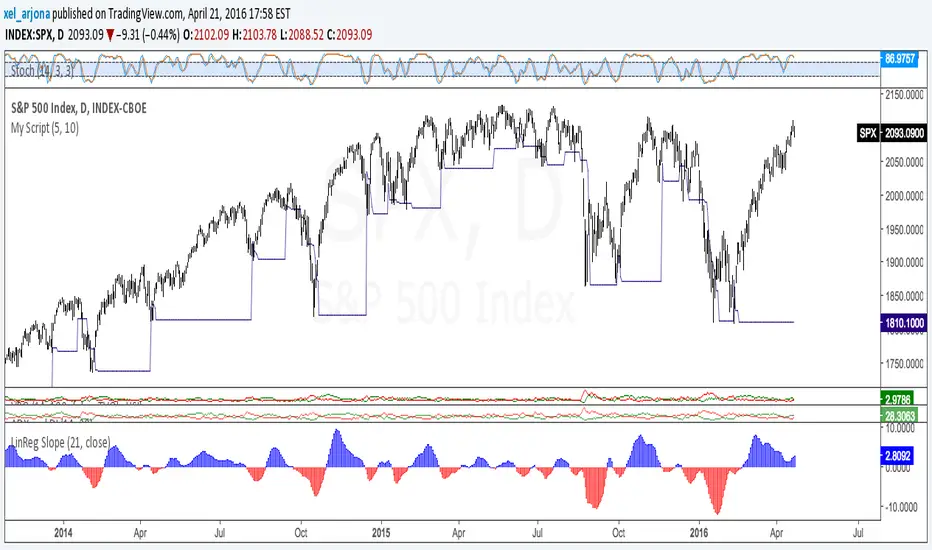
WHAT'S THIS?
This is a REAL mathematically approach of an ORDINARY LEAST SQUARES LINE FITTING SLOPE as TradingView currently don't have a native one embedded, neither as a pine function. Other "Sope" indicators from this linear regression model I found on public library are currently based on "momentum" rather tan slope.
Any modifications or additions are quite welcome!
Cheers!
xel_arjona
Ver. 1 by Ricardo M Arjona xel_arjona
DISCLAIMER:
The Following indicator/code IS NOT intended to be a formal investment advice or recommendation by the author, nor should be construed as such. Users will be fully responsible by their use regarding their own trading vehicles/assets.
The embedded code and ideas within this work are FREELY AND PUBLICLY available on the Web for NON LUCRATIVE ACTIVITIES and must remain as is.
WHAT'S THIS?
This is a REAL mathematically approach of an ORDINARY LEAST SQUARES LINE FITTING SLOPE as TradingView currently don't have a native one embedded, neither as a pine function. Other "Sope" indicators from this linear regression model I found on public library are currently based on "momentum" rather tan slope.
Any modifications or additions are quite welcome!
Cheers!
xel_arjona
Skrip open-source
Dengan semangat TradingView yang sesungguhnya, pembuat skrip ini telah menjadikannya sebagai sumber terbuka, sehingga para trader dapat meninjau dan memverifikasi fungsinya. Salut untuk penulisnya! Meskipun Anda dapat menggunakannya secara gratis, perlu diingat bahwa penerbitan ulang kode ini tunduk pada Tata Tertib kami.
Pernyataan Penyangkalan
Informasi dan publikasi ini tidak dimaksudkan, dan bukan merupakan, saran atau rekomendasi keuangan, investasi, trading, atau jenis lainnya yang diberikan atau didukung oleh TradingView. Baca selengkapnya di Ketentuan Penggunaan.