OPEN-SOURCE SCRIPT
Diupdate The Echo Forecast [LuxAlgo]
This indicator uses a simple time series forecasting method derived from the similarity between recent prices and similar/dissimilar historical prices. We named this method "ECHO".
This method originally assumes that future prices can be estimated from a historical series of observations that are most similar to the most recent price variations. This similarity is quantified using the correlation coefficient. Such an assumption can prove to be relatively effective with the forecasting of a periodic time series. We later introduced the ability to select dissimilar series of observations for further experimentation.
This forecasting technique is closely inspired by the analogue method introduced by Lorenz for the prediction of atmospheric data.
1. Settings
Other style settings are self-explanatory.
2. Usage
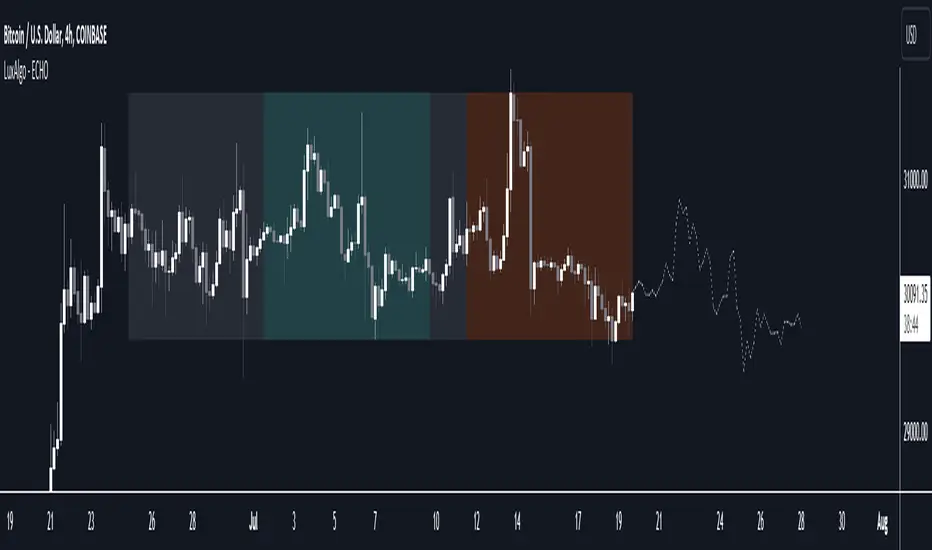
This tool can be used to forecast future trends but also to indicate which historical variations have the highest degree of similarity/dissimilarity between the observations in the orange zone.
The forecasting window determines the prices segment (in orange) to be used as a reference for the search of the most similar/dissimilar historical price segment (in green) within the gray area.

Most forecasting techniques highly benefit from a detrended series. Due to the nature of this method, we highly recommend applying it to a detrended and periodic series.

You can see above the method is applied on a smooth periodic oscillator and a momentum oscillator.
The construction of the forecast is made from the price changes obtained in the green area, denoted as w(t). Using the "Cumulative" options we construct the forecast from the cumulative sum of w(t). Finally, we add the most recent price value to this cumulated series.

Using the "Mean" options will add the series w(t) with the mean of the prices within the orange segment.

Finally the "Linreg" will add the series w(t) to an extrapolated linear regression fit to the prices within the orange segment.
This method originally assumes that future prices can be estimated from a historical series of observations that are most similar to the most recent price variations. This similarity is quantified using the correlation coefficient. Such an assumption can prove to be relatively effective with the forecasting of a periodic time series. We later introduced the ability to select dissimilar series of observations for further experimentation.
This forecasting technique is closely inspired by the analogue method introduced by Lorenz for the prediction of atmospheric data.
1. Settings
- Evaluation Window: Window size used for finding historical observations similar/dissimilar to recent observations. The total evaluation window is equal to "Forecast Window" + "Evaluation Window"
- Forecast Window: Determines the forecasting horizon.
- Forecast Mode: Determines whether to choose historical series similar or dissimilar to the recent price observations.
- Forecast Construction: Determines how the forecast is constructed. See "Usage" below.
- Src: Source input of the forecast
Other style settings are self-explanatory.
2. Usage
This tool can be used to forecast future trends but also to indicate which historical variations have the highest degree of similarity/dissimilarity between the observations in the orange zone.
The forecasting window determines the prices segment (in orange) to be used as a reference for the search of the most similar/dissimilar historical price segment (in green) within the gray area.
Most forecasting techniques highly benefit from a detrended series. Due to the nature of this method, we highly recommend applying it to a detrended and periodic series.
You can see above the method is applied on a smooth periodic oscillator and a momentum oscillator.
The construction of the forecast is made from the price changes obtained in the green area, denoted as w(t). Using the "Cumulative" options we construct the forecast from the cumulative sum of w(t). Finally, we add the most recent price value to this cumulated series.
Using the "Mean" options will add the series w(t) with the mean of the prices within the orange segment.
Finally the "Linreg" will add the series w(t) to an extrapolated linear regression fit to the prices within the orange segment.
Catatan Rilis
Minor changes.Catatan Rilis
Updated styling & switched to version 5.Skrip open-source
Dengan semangat TradingView yang sesungguhnya, pembuat skrip ini telah menjadikannya sebagai sumber terbuka, sehingga para trader dapat meninjau dan memverifikasi fungsinya. Salut untuk penulisnya! Meskipun Anda dapat menggunakannya secara gratis, perlu diingat bahwa penerbitan ulang kode ini tunduk pada Tata Tertib kami.
Get exclusive indicators & AI trading strategies: luxalgo.com
Free 150k+ community: discord.gg/lux
All content provided by LuxAlgo is for informational & educational purposes only. Past performance does not guarantee future results.
Free 150k+ community: discord.gg/lux
All content provided by LuxAlgo is for informational & educational purposes only. Past performance does not guarantee future results.
Pernyataan Penyangkalan
Informasi dan publikasi ini tidak dimaksudkan, dan bukan merupakan, saran atau rekomendasi keuangan, investasi, trading, atau jenis lainnya yang diberikan atau didukung oleh TradingView. Baca selengkapnya di Ketentuan Penggunaan.
Skrip open-source
Dengan semangat TradingView yang sesungguhnya, pembuat skrip ini telah menjadikannya sebagai sumber terbuka, sehingga para trader dapat meninjau dan memverifikasi fungsinya. Salut untuk penulisnya! Meskipun Anda dapat menggunakannya secara gratis, perlu diingat bahwa penerbitan ulang kode ini tunduk pada Tata Tertib kami.
Get exclusive indicators & AI trading strategies: luxalgo.com
Free 150k+ community: discord.gg/lux
All content provided by LuxAlgo is for informational & educational purposes only. Past performance does not guarantee future results.
Free 150k+ community: discord.gg/lux
All content provided by LuxAlgo is for informational & educational purposes only. Past performance does not guarantee future results.
Pernyataan Penyangkalan
Informasi dan publikasi ini tidak dimaksudkan, dan bukan merupakan, saran atau rekomendasi keuangan, investasi, trading, atau jenis lainnya yang diberikan atau didukung oleh TradingView. Baca selengkapnya di Ketentuan Penggunaan.