OPEN-SOURCE SCRIPT
Composite RSI [KFB Quant]
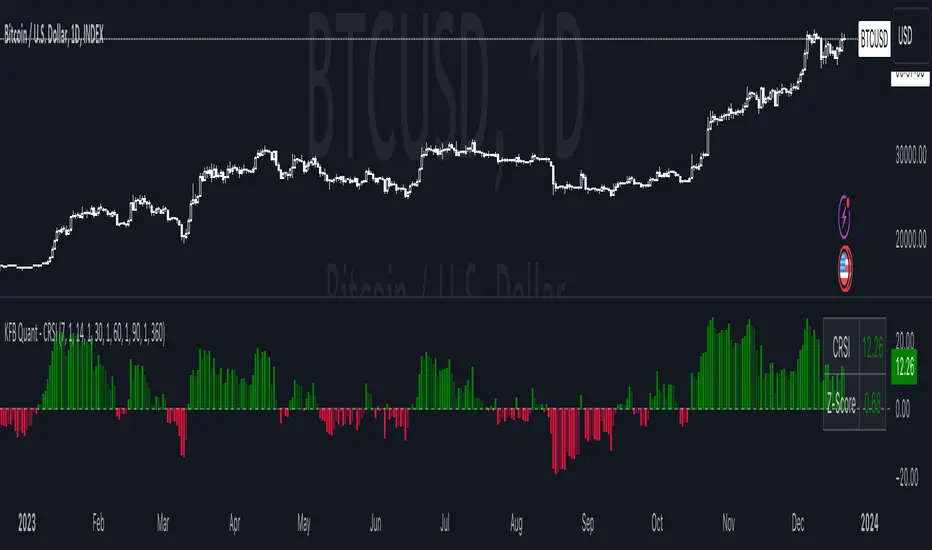
The Composite RSI (CRSI) is a momentum oscillator that combines 5 adjustable RSI's. It also has a Z-Score to make it easier to identify potential market extremes.
How to adjust the indicator
How to adjust the indicator
- Inside the Length & Impact Configuration tab you can adjust the length and impact of each RSI as well as the Z-Score length specific to your needs. The default length inputs are 7, 14, 30, 60, 90 (RSI 1 - RSI 5) and the default impact is set to 1.0 for all RSI's. Default length for Z-Score is 360.
- Inside the Style Configuration tab you can pick what you want to display(plot). The options are: CRSI, Z-Score, Overview Table and the individual RSI's.
- Inside the Color Configuration tab you can customize the color of each plot.
How the script worksCRSI = rsi_sum / imp_sumZ-Score = (crsi - crsi_mean) / crsi_stdev - rsi_sum = (rsi_1 -50) + (rsi_2 -50) + (rsi_3 -50) + (rsi_4 -50) + (rsi_5 -50)
- imp_sum = imp_1 + imp_2 + imp_3 + imp_4 + imp_5
- crsi_mean = Average of the crsi over the defined period in Z-Score Length
- crsi_stdev = StDev of crsi over the defined period in Z-Score Length
This is not financial advice. Trading is risky & most traders lose money. Past performance does not guarantee future results. This indicator is for informational & educational purposes only.
Skrip open-source
Dengan semangat TradingView yang sesungguhnya, pembuat skrip ini telah menjadikannya sebagai sumber terbuka, sehingga para trader dapat meninjau dan memverifikasi fungsinya. Salut untuk penulisnya! Meskipun Anda dapat menggunakannya secara gratis, perlu diingat bahwa penerbitan ulang kode ini tunduk pada Tata Tertib kami.
Pernyataan Penyangkalan
Informasi dan publikasi ini tidak dimaksudkan, dan bukan merupakan, saran atau rekomendasi keuangan, investasi, trading, atau jenis lainnya yang diberikan atau didukung oleh TradingView. Baca selengkapnya di Ketentuan Penggunaan.